As construction projects get larger and more complicated, it becomes more difficult to make the final decision because of several factors such as cost, time, environment. Multi-objective optimization model provides a solution to this problem by making use of the Pareto front. This method can be used to assess multiple optimization objectives such as initial cost, maintenance cost, emission cost, etc.
The Aim of a Multi-objective Optimization is to give the stakeholders an assist by the decision-making process. The method works by generating a high number of solutions over an interval and evaluate the results based on the objectives and the key results or key performance indicators.
The Algorithm may take a high computational capacity. To overcome the problem, the models are usually reduced to the minimal needed complexity. The model of the integrated system has eight Parameters and nine outcomes. The algorithm will randomly generate, inside the given boundaries, a finite number of models and evaluate them based on the weighing of the criteria and choose the best models or solutions. Models, which have the best evaluation are called a Pareto Optimality and the whole group of best solutions is the Pareto frontier. Pareto optimality is defined as a state or an instant, which balances the results of the model in a way, that moving away on the Axis of any parameter will not result a bettering of the performance of a criterion without degrading another criterion.
Due to the complexity of the models, the maintenance interventions for the subsystems examined in the second assignment are used instead of the overall systems. The parameters of the model can be expanded here as required.
Subsequently, the most appropriate solution can be identified. It is implemented by following these steps [1]:identification of the problem
- standardization of the objectives
- establishment of the genetic algorithm.
- identification of the optimization objectives
- developing the data structure
- definition of the fitness function
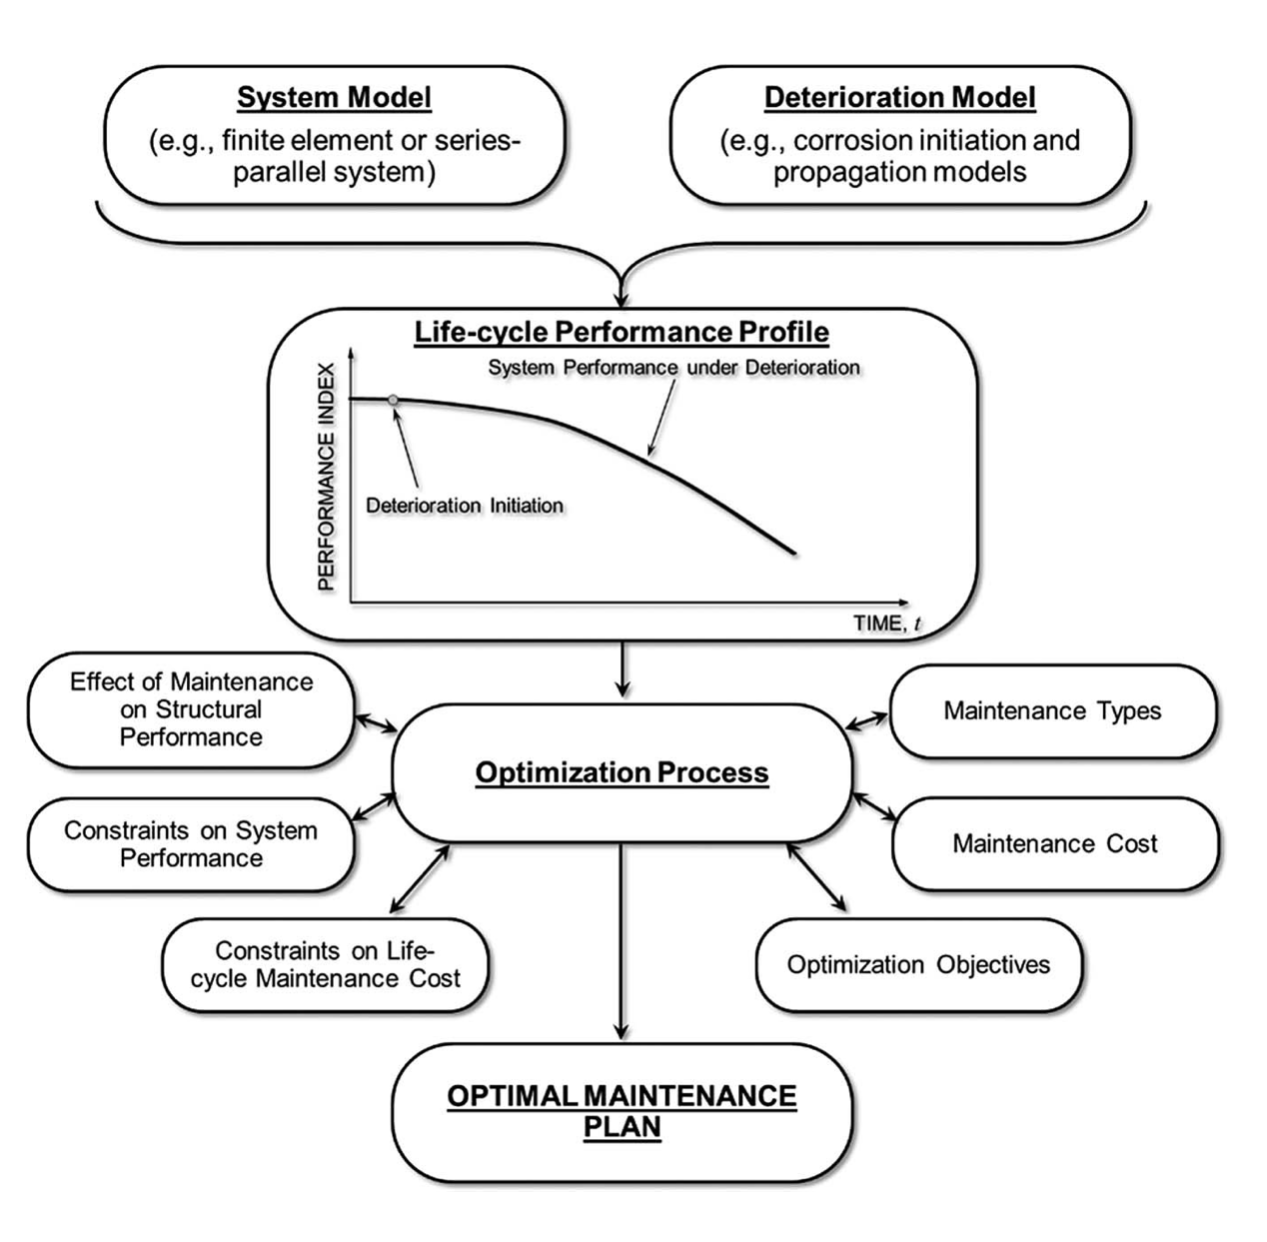 Figure 1. General optimization procedure for maintenance scheduling [2]
As for the total number of interruptions and the maximum distance between interventions, we have taken into account a large set of variables that play a role in our analysis. The mean value of the duration between interventions is calculated to give a rough estimate about the total duration. The aim is to maximize this as the systems should be able to operate without interventions as much as possible.
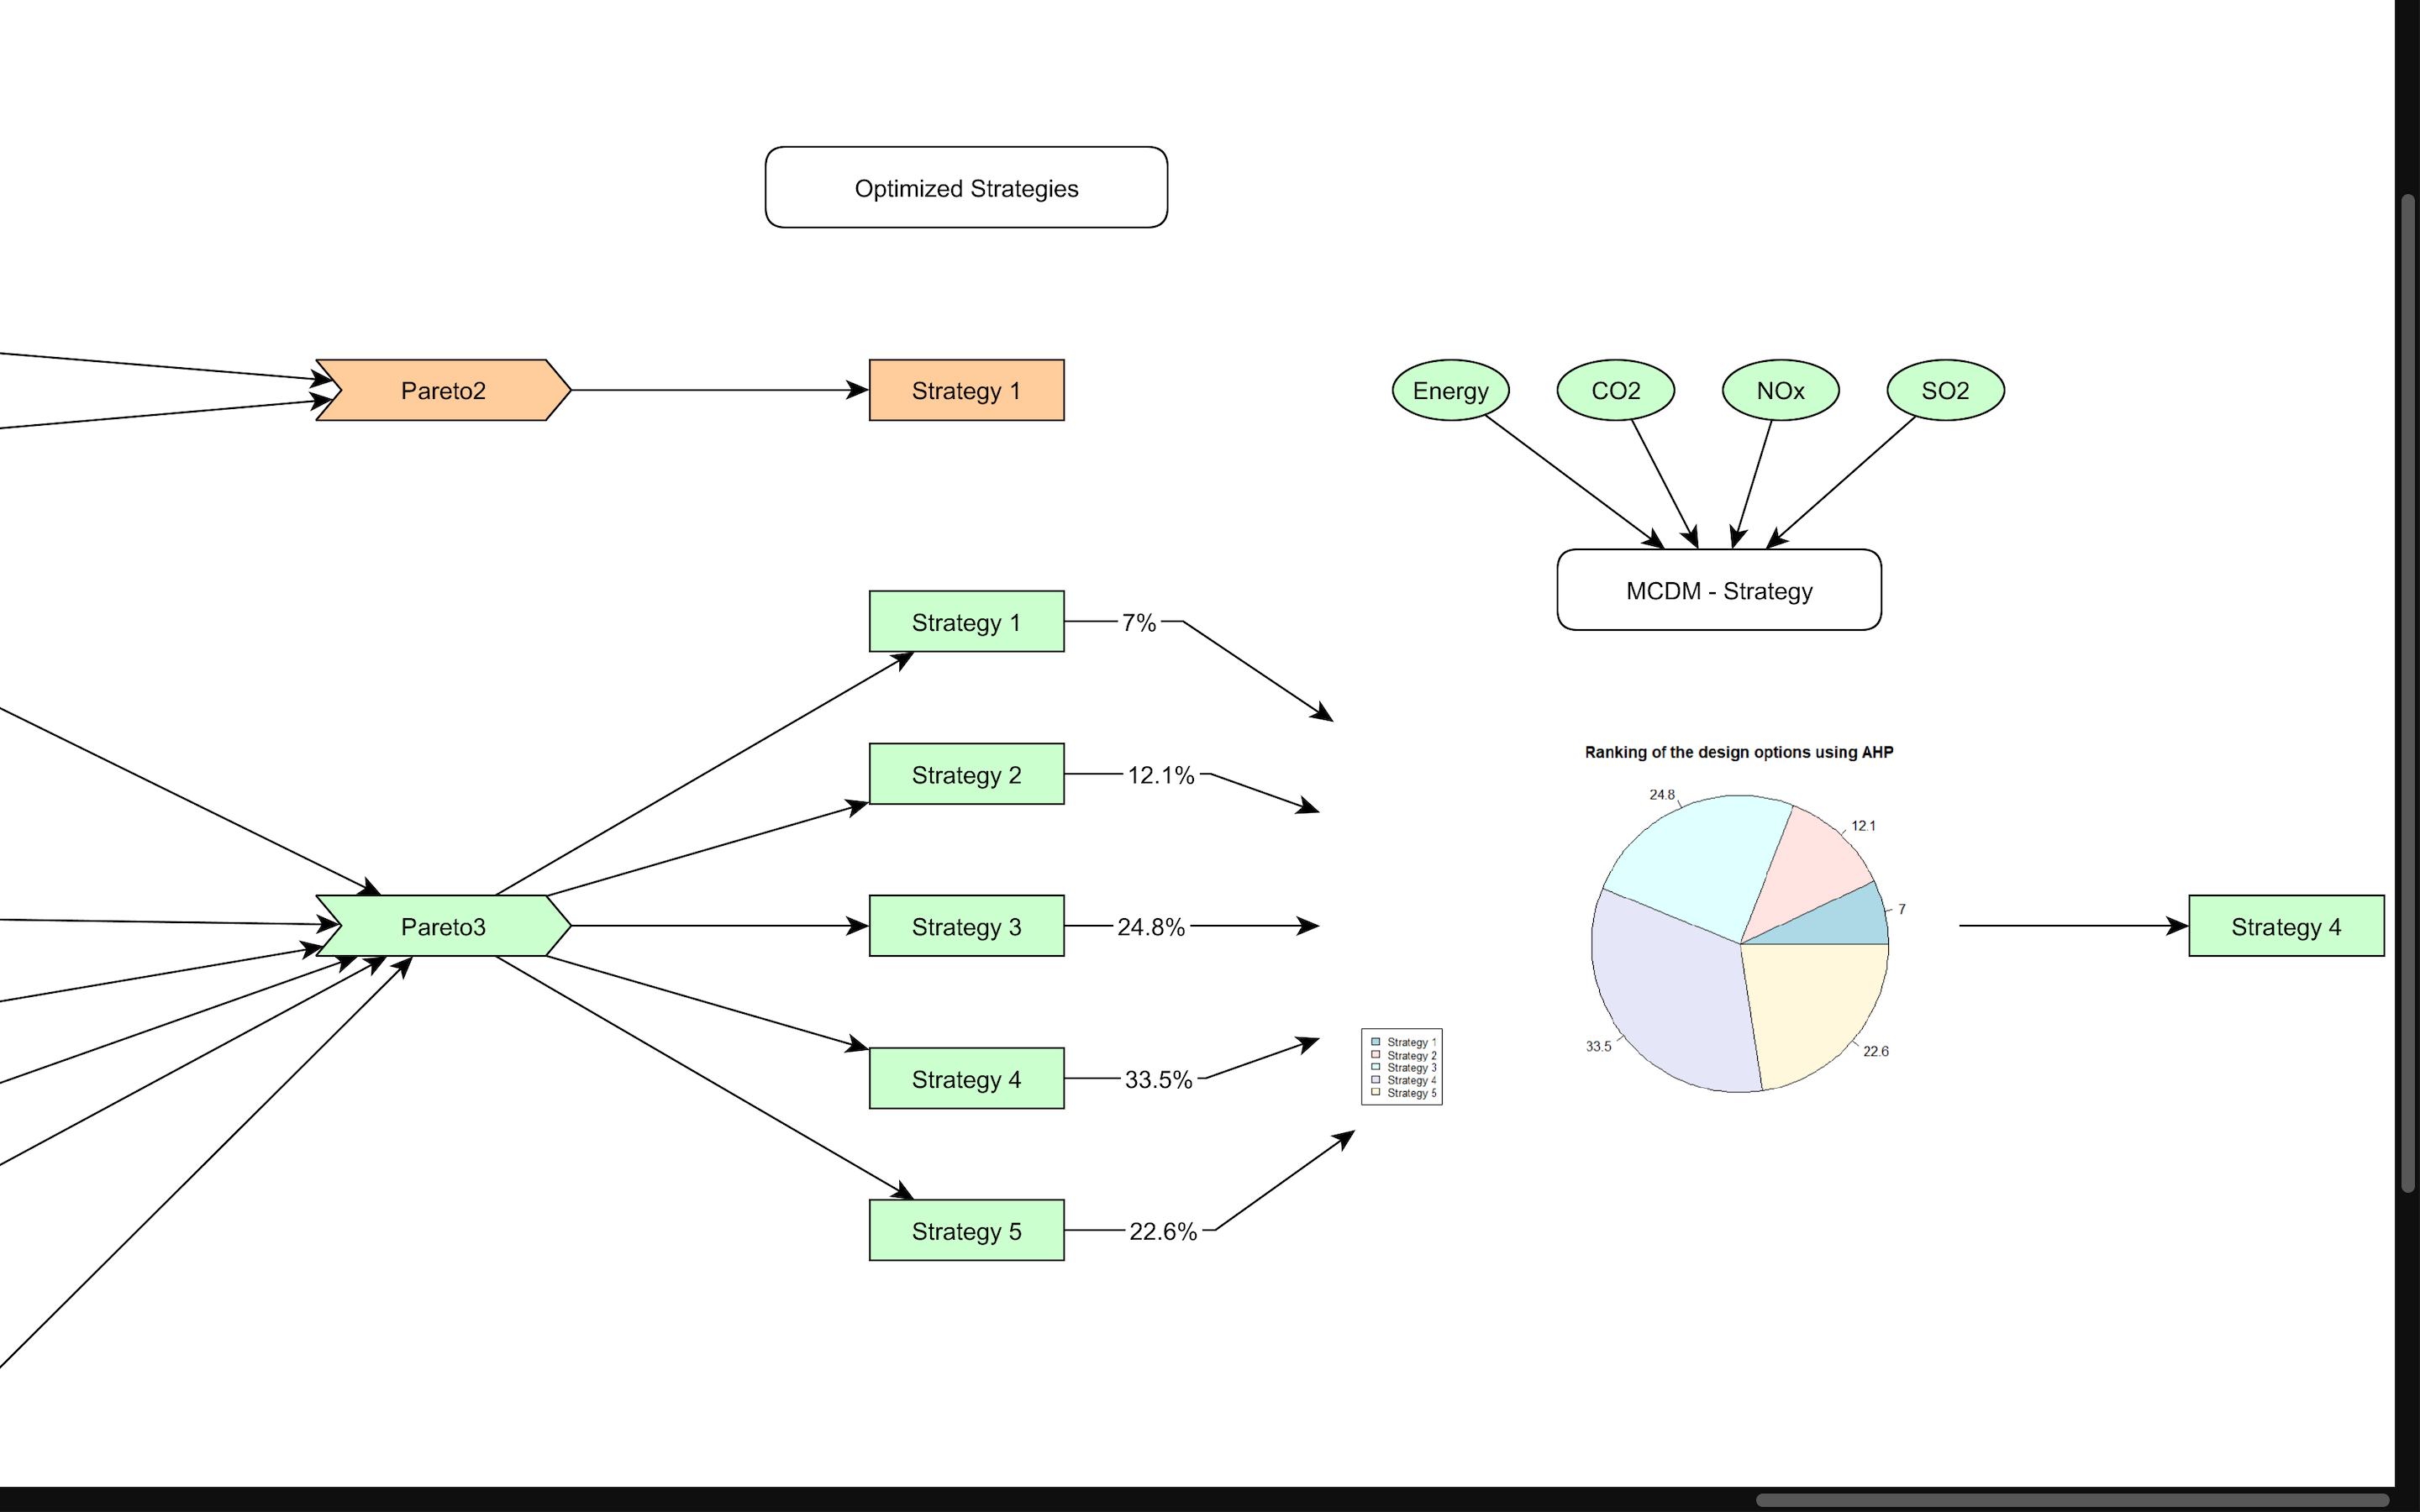
The three parameters that we follow in this integration are costs, total intervention time and the distance between the interventions. The best options would have a maximized distance between the interventions and minimized cost and distance. The pareto front described by the total duration of the interventions and the cost is shown below:
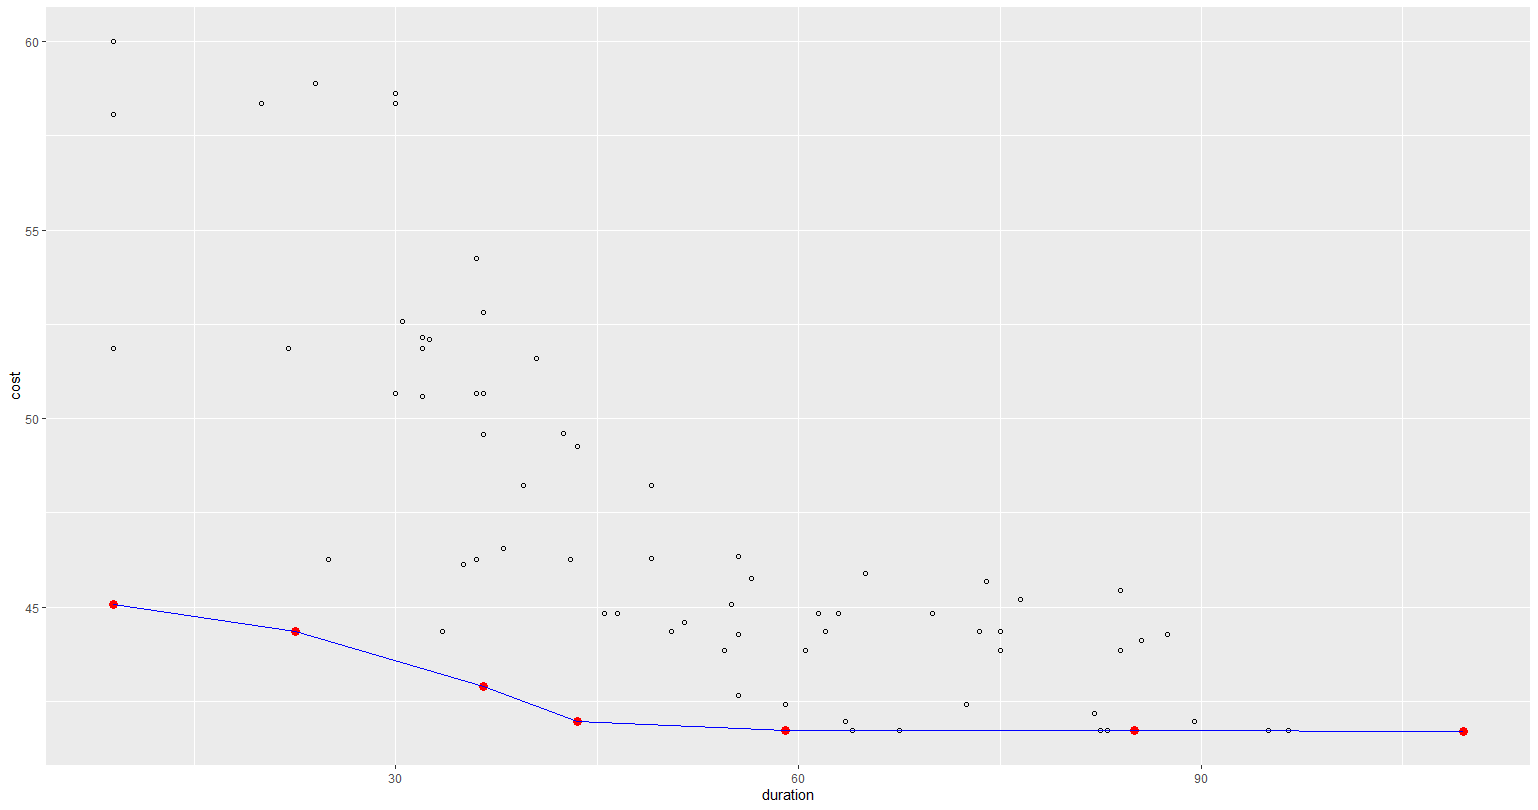
Fig 2. Pareto Frontier – Duration, Distance and Cost
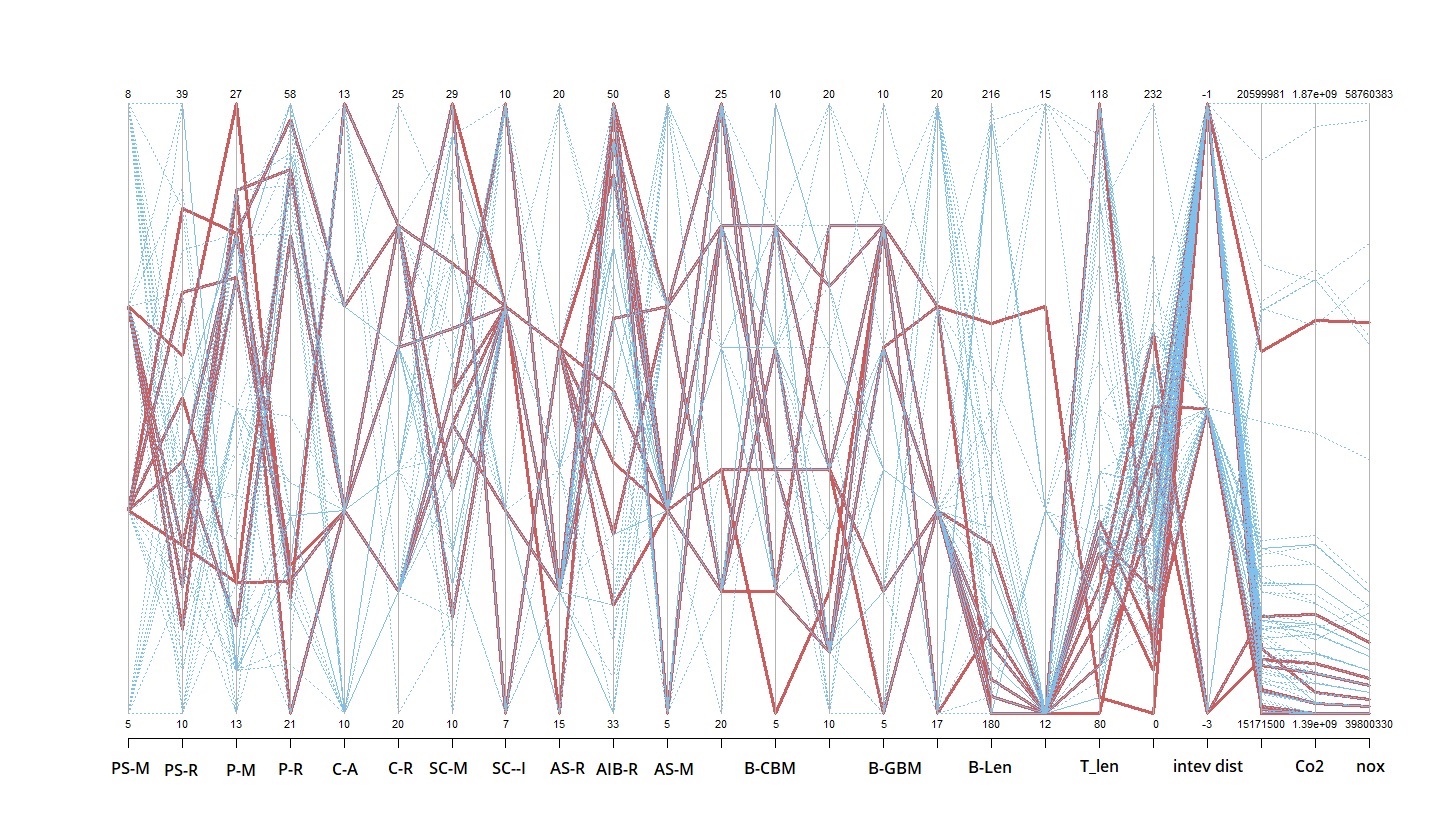
To see the accumulated impact of the input parameters on the performance criteria, duration and time gap between the interventions are visualised below. The red lines represent the optimal solutions while the blue lines represent the non-optimal solutions.
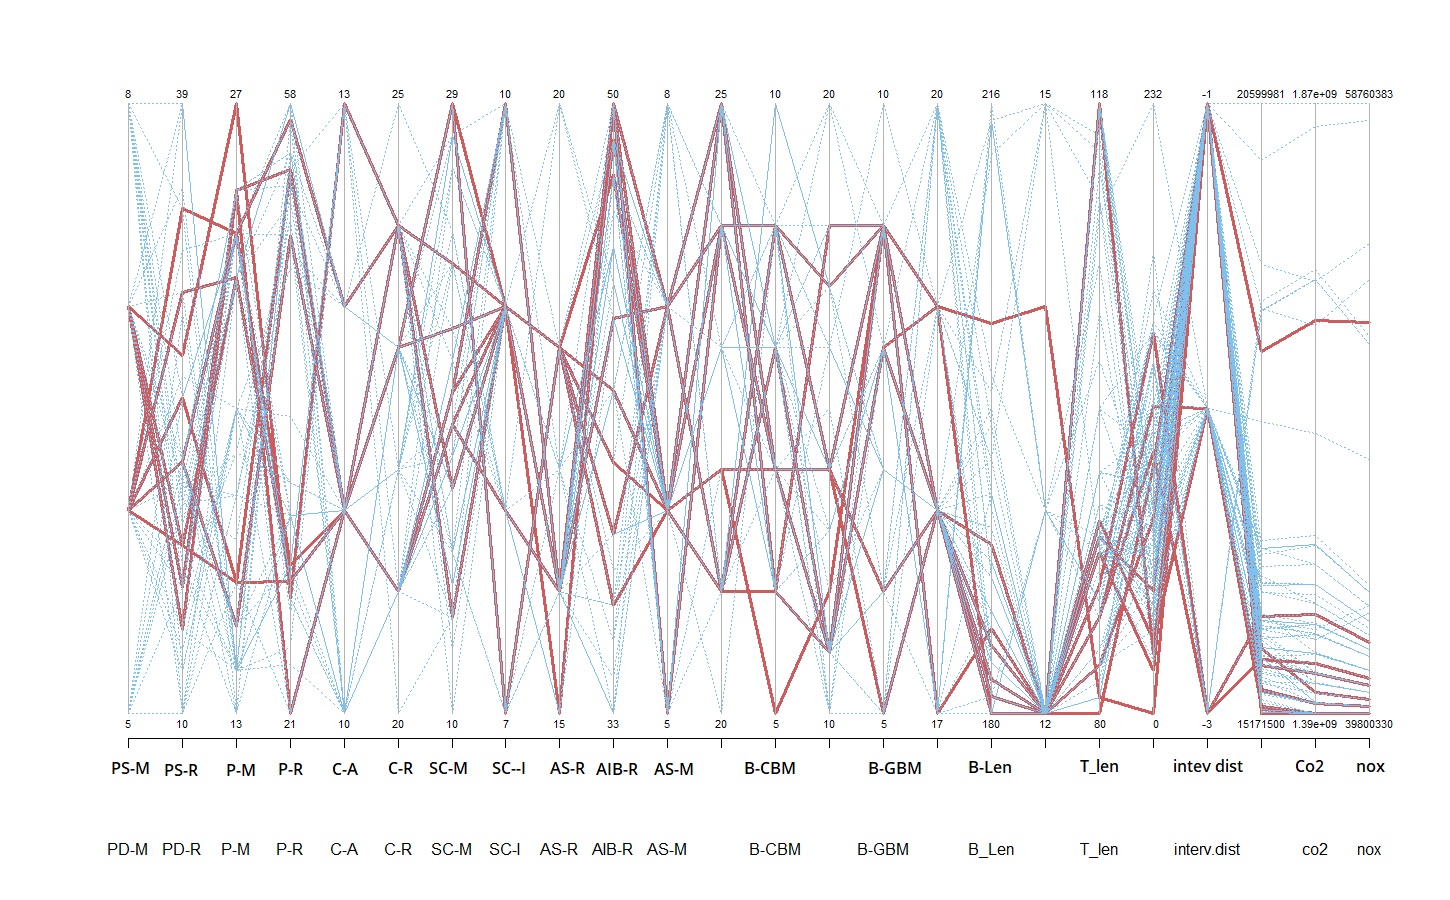
Fig 3. Accumulated Impact
REFERENCES
[1] Q. Zhang, K. B, H. MacLean and J. Feng, “Life-cycle inventory of energy use and greenhouse gas emissions for two hydropower projects in China,” Journal of Infrastructure Systems, pp. 271-279, 2007.
[2] P. Meier, “Life-cycle assessment of electricity generation systems and climate applications,” University of Wisconsin-Madison, 2002.
[3] S. Kim and B. Dale, “Life cycle inventory information of the United States electricity system,” The International Journal of Life Cycle Assessment, no. 10, pp. 294-304, 2005.
[4] Guide To Concrete Repair, 2nd ed., U.S. Department of the Interior Bureau of Reclamation, 2015.
[5] Y. Lei, Q. Zhang, C. Nielsen and K. He, “An inventory of primary air pollutants and CO2 emissions from cement production in China, 1990-2020,” Atmospheric Environment, no. 45, pp. 147-154, 2011.
[6] “Emission Factor Documentation for AP-42:Iron and Steel Production,” U. S. Environmental Protection Agency, 2009.
[7] “Emission Factor Documentation for AP-42: Sand and Gravel Processing,” U. S. Environmental Protection Agency, 1995.
[8] J. de Brito and F. Agrela, “Life cycle assessment applied to recycled aggregate concrete,” in New Trends in Eco-efficient and Recycled Concrete, Woodhead Publishing, 2019.
[9]Maintenance of Structures and Infrastructure Systems, Mohamed Soliman, A.M.ASCE* Dan M. Frangopol, Dist.M.ASCE†
[10] Choongwan Koo, Taehoon Hong & Sangbum Kim (2015) An integrated multi-objective optimization model for solving the construction time-cost trade-off problem, Journal of Civil Engineering and Management, 21:3, 323-333, DOI: 10.3846/13923730.2013.802733