An LCA is a valuable tool for understanding and optimizing the environmental impacts of structures, such as bridges, tunnels, or buildings. It provides a comprehensive assessment of resource use and environmental impacts throughout the life cycle of a structure. In addition, an LCA can also be used to make decisions about the selection of materials, production processes, or energy sources that contribute to a lower environmental impact. The standard framework can be found in [1] and [2].
Besides the sustainability assessment of a product, there are further reasons for an LCA, such as:
- Comparability: Through an LCA, different options can be compared in order to select the most appropriate option that contributes to a lower environmental impact.
- Transparency: an LCA provides information that can help make decisions regarding products and services more transparent and understandable.
- Regulatory requirements: In some industries and countries, LCA is required by regulatory requirements to assess the environmental impact of products and services.
- Risk assessment: LCA can also be used to assess and minimize risks associated with the environmental impacts of products and services.
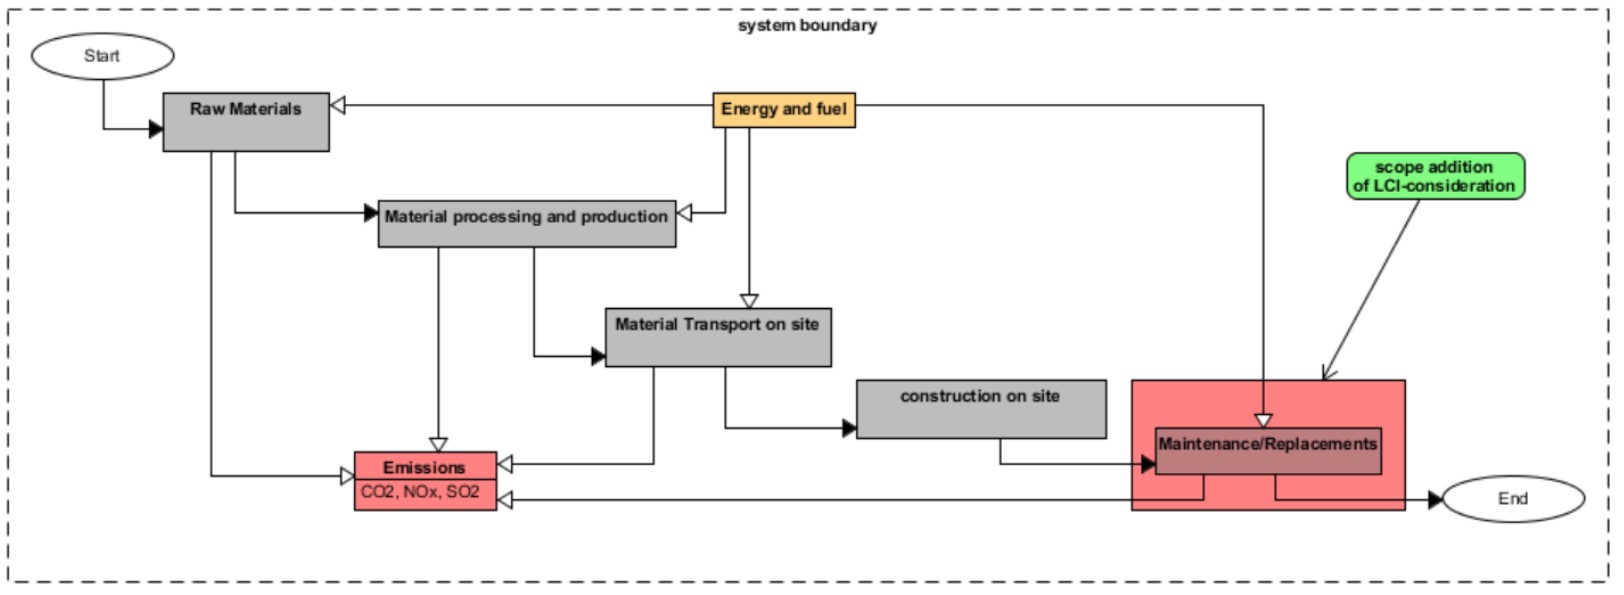
In the LCA of the overall system in the remote area, the emission values and the associated costs can be calculated on the basis of the use of materials and the associated emissions. Besides the overall embodied emissions for the material value chain until the construction, the maintenance scenarios of the optimized individual subsystem maintenance plans are now taken into account in the LCA. The scope expansion of the analysis is shown in Figure 1.
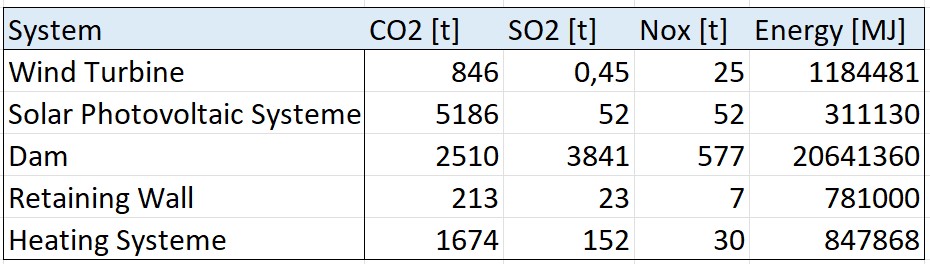
As already pointed out previously, our system consists of five different subsystems. All have different embodied emissions for production, along with the energy required. From the life cycle inventory of the meta-system
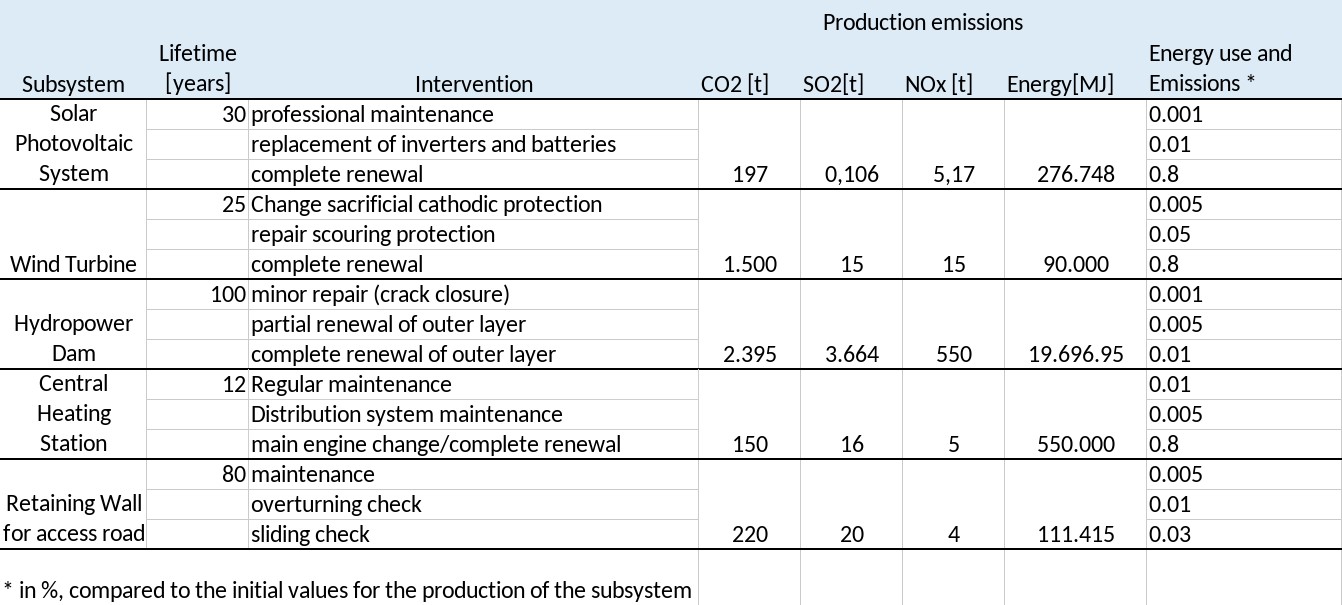
As depicted in Figure 2, the embodied emissions of the subsystems vary greatly due to a range of factors, including the size of the systems, the materials used, and the amount and type of energy required for production. By combining the embodied emissions and energy requirements of each subsystem, the whole System has embodied emissions of 4,462 tons of CO2, 3,715 tons of SO2, 580 tons of NOx, and an energy requirement of 20,724,113 MJ. At this point, the energy expended up to the commissioning of the system is represented.
The operational lifetime of 100 years, shown in the maintenance planning, is accompanied by further inspections, maintenance work and repairs, which result in further emissions. Therefore, it seems reasonable to have a further look at the emission occurring during the lifetime and its maintenance actions. The emissions shown in Figure 2 form the basis for the calculation of further environmental impacts due to maintenance and repair measures. In order to quantify these, the function LCA.bridge within the R-Script follows a percentage-weighted approach to the respective interventions. The percentage weighting factors are listed in Figure 2 as “energy use and emissions”. By means of an example, the influence of further emissions can be illustrated. Within the calculation for partial renewal of the outer layer of the hydropower dam, 0.005% of the total production emissions of the dam occur every 10–22 years. For example, this could result in between 4992398.75 and 984797.5 MJ of additional energy for a single maintenance job. It should be noted that significant maintenance factors of 80% versus production, f.e. the third solar system intervention, are to be understood in the overall context. The solar system has an individual lifetime of 30 years and must therefore be renewed 3 times, each with 80% of the production emission, in the context of the meta-system. The individual design options have the following maintenance emissions.
The analysis of maintenance emissions shows that, for example, the CO2 share for the maintenance measures of a wind turbine is 429% compared to the production emissions. It should be noted that in the case of the meta-system, the wind turbine has already been fully repaired three times over a period of 100 years, as the total lifetime of the meta-system is dependent on the system. For the Dam, which requires only minor repairs in relation to its overall size, maintenance emissions account for only 4.8% of emissions. Thus, the individual consideration of system components may lead to the distortion of the emissions to be calculated. Furthermore, identifying the same annual number of maintenance measures, such as sharing equipment and site furnishings, would further support the synergistic effects. In this example, only the synergy effects of the individual subsystems’ maintenance measures have been captured by the dist.events function.
It can be seen that maintenance is not only subject to reasonable scheduling but that its contribution to total emissions is significant. Thus, for system engineers and asset managers, the comparison of further aspects, such as the monetary costs as a measure of system performance, is of interest. The relevant emissions were priced as followed, based on [3] and assumptions.
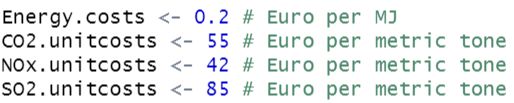
The added costs per tonne or MJ lead to the below-presented results.
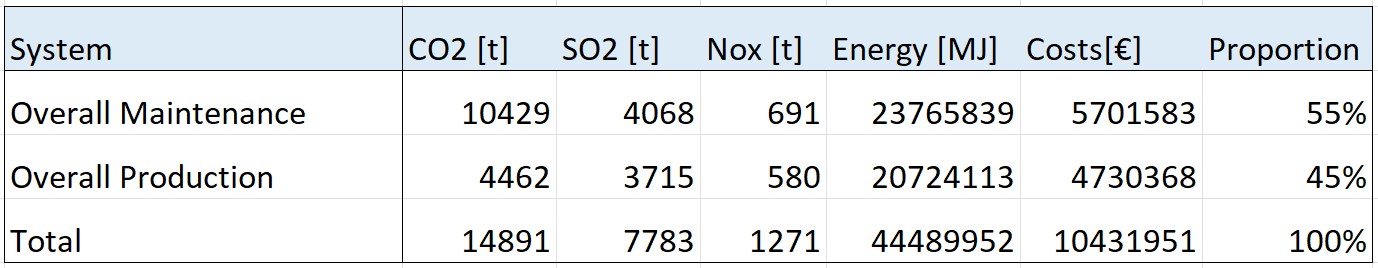
It can be seen that the total system’s emissions will cost €10.4 million over the 100-year service life, of which 55% is maintenance and 45% production emission costs. Executive costs, such as wages, are not included in the maintenance costs. The high share for the maintenance results in the meta-system from the multiple renewals of the solar, wind turbine and heating system. As described above, the repaving of the hydro dam accounts for only a small proportion of its and total emissions. In summary, LCA can be useful for various aspects, such as comparability, transparency, regulatory requirements, and risk assessment. In the study shown, the focus is mainly on sustainability assessment. This suggests that maintenance intervals should be planned sensibly and linked together so that the number of repairs is optimized and the emission input is reduced. Attention should also be paid to how cost-intensive the products used are with regard to the factors considered previously. In order to implement synergetic effects to optimize the overall performance of the system, an analysis with the help of multi-objective optimization is recommended.
References:
[1] https://www.iso.org/standard/37456.html
[2] https://www.iso.org/standard/38498.html
[3] https://www.bundesregierung.de/breg-de/themen/klimaschutz/co2-bepreisung-1673008