Goal and Scope
It is generally known that the manufacture of structural timber is more eco-friendly comparing to those of concrete or steel. However timber bridges needs more frequent maintenance/replacement. Therefore, it is interesting to conduct an LCA study and assess the environmental impact of different designs for the timber superstructure system by performing a carbon footprint analysis.
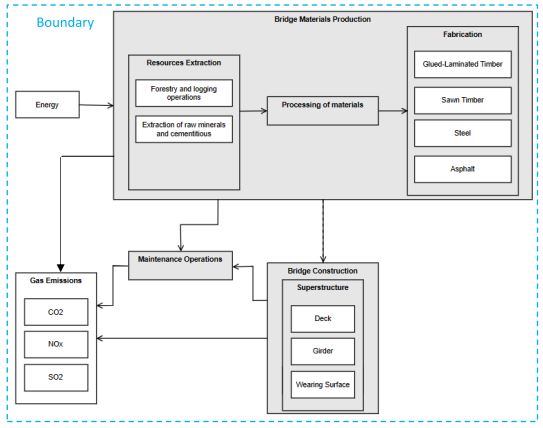
In the scope the system boundary involves energy and mass flows by processing of raw materials from forestry and logging operations to construction (refer to figure 2.1.1). Only main components of large quantities (i.e. deck, girders, wearing surface,…) were included within the system boundary; any materials used in connections, such as bolts, are neglected for its relatively low contribution to the analysis.
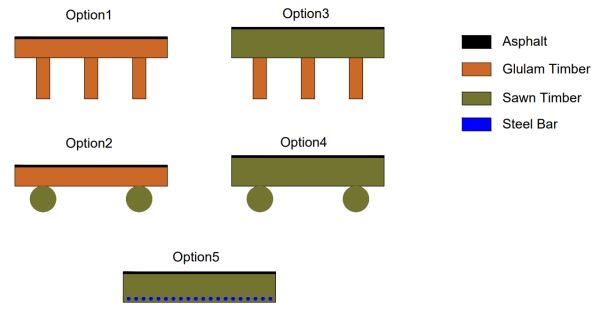
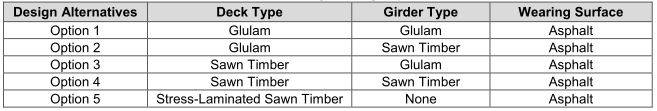
Design Alternatives
The design alternatives are presented in figure 2.1.2 and table 2.1.1.
Life-Cycle Analysis
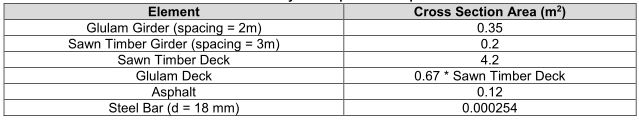
Based on the summary of components properties in figure 2.1.3
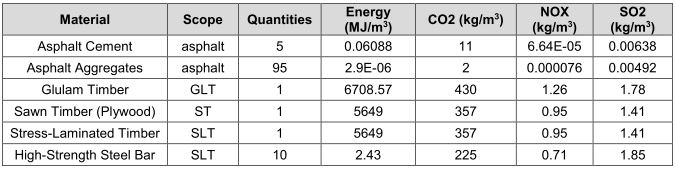
and LCI and performance indicators as presented in figure 2.1.4
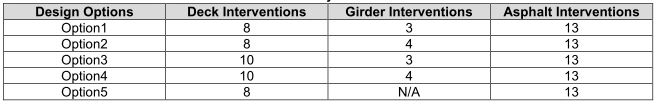
and the summary of interventions as shown in figure 2.1.5
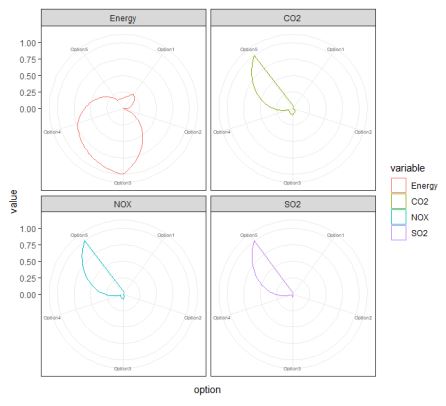
it was possible to do a life-cycle analysis based on consumptions and emissions as presented in figure 2.1.6.
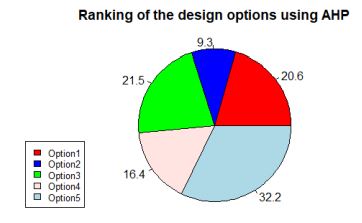
MCDA – Analytic Hierarchy Process (AHP)
By adding weights and a pairwise comparision via matrix presentation it was possible to identify the best alternative under the presented designs in the front. The results of the AHP are presented in figure 2.1.7.