A Life Cycle Analysis (LCA) is conducted to percive the environmental impact of a system over its entire lifetime. As defined in the previous page Scope and Goal we are taking the total energy consumption, C02 and NOx emission and SO2 pollution into account. Therefore, a life cycle inventory is composed with the materials that are used in the life cycle analysis. The LCI can be seen in Table 1 below.
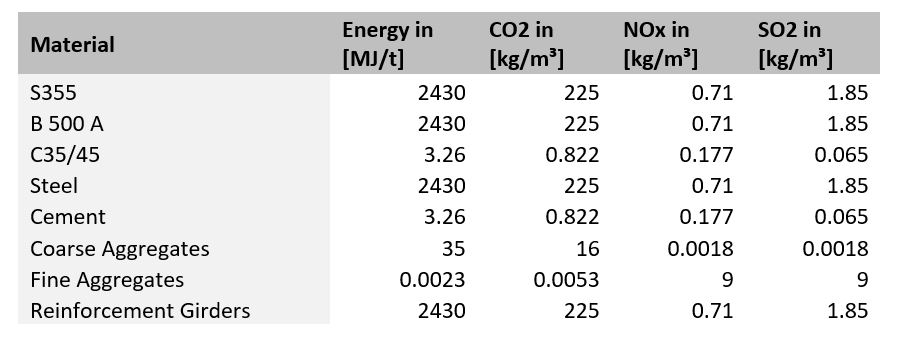
Table 1 – Section of the Life Cycle Inventory table
Furthermore, we are going to assign a certain cost to each indicator (Table 2).
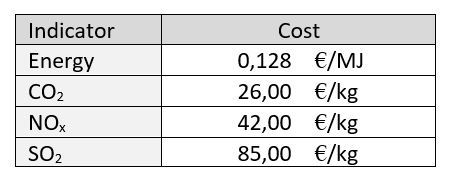
Table 2 – Environmental costs for each indicator
Now, the LCA can be conducted by taking into account the values of the LCI and environmental costs. First, it is interesting to see the environmental impact of each subsystem. As it can be seen in Figure 1, the bridge deck has a great environmental impact whereas the other subsystems has a significantly low impact. The reason for that is that the bridge deck has a steel girder. As in Table 1 shown, steel has higher values for each indicator compared to the other materials.
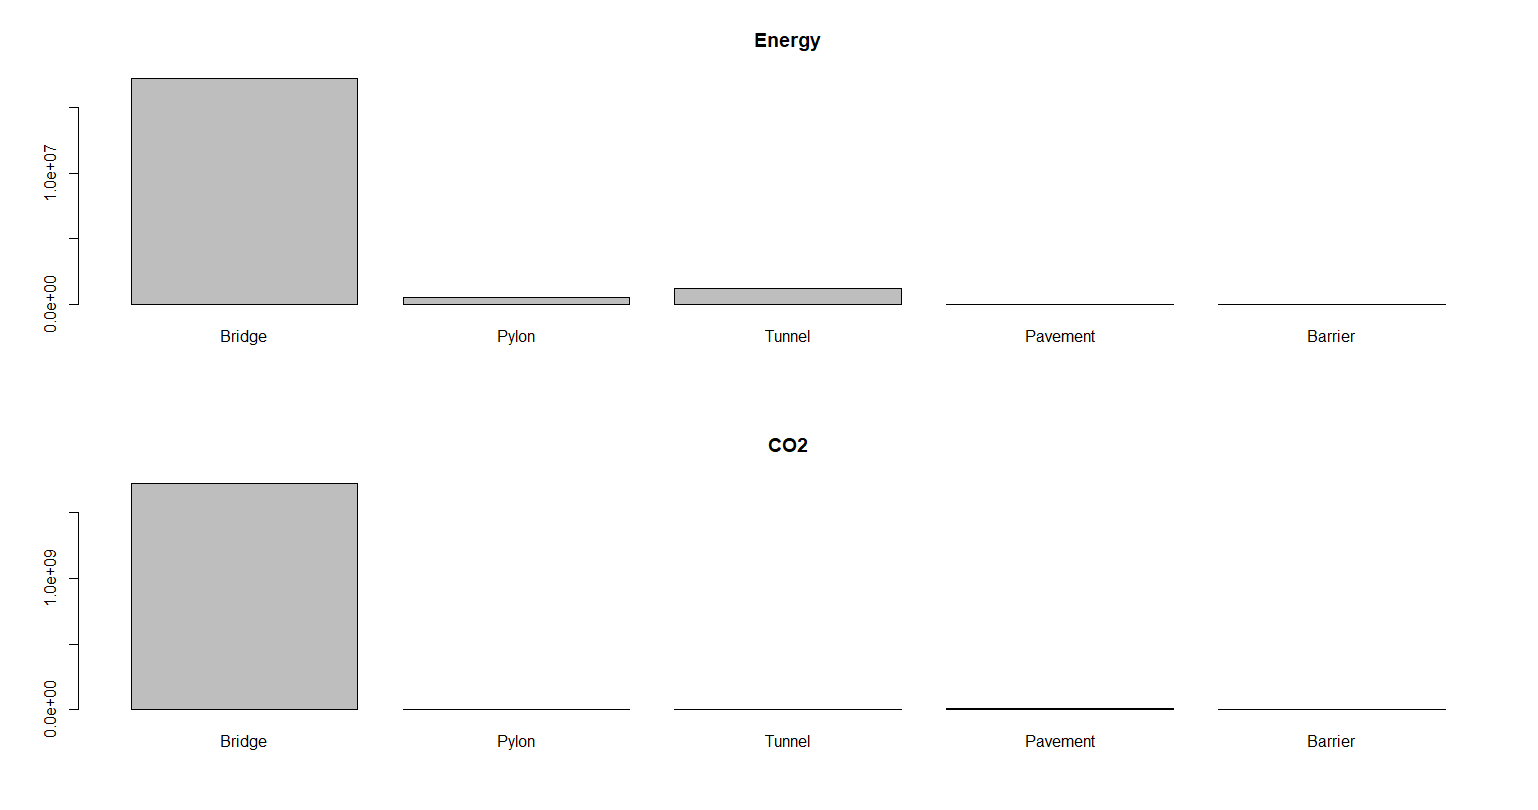
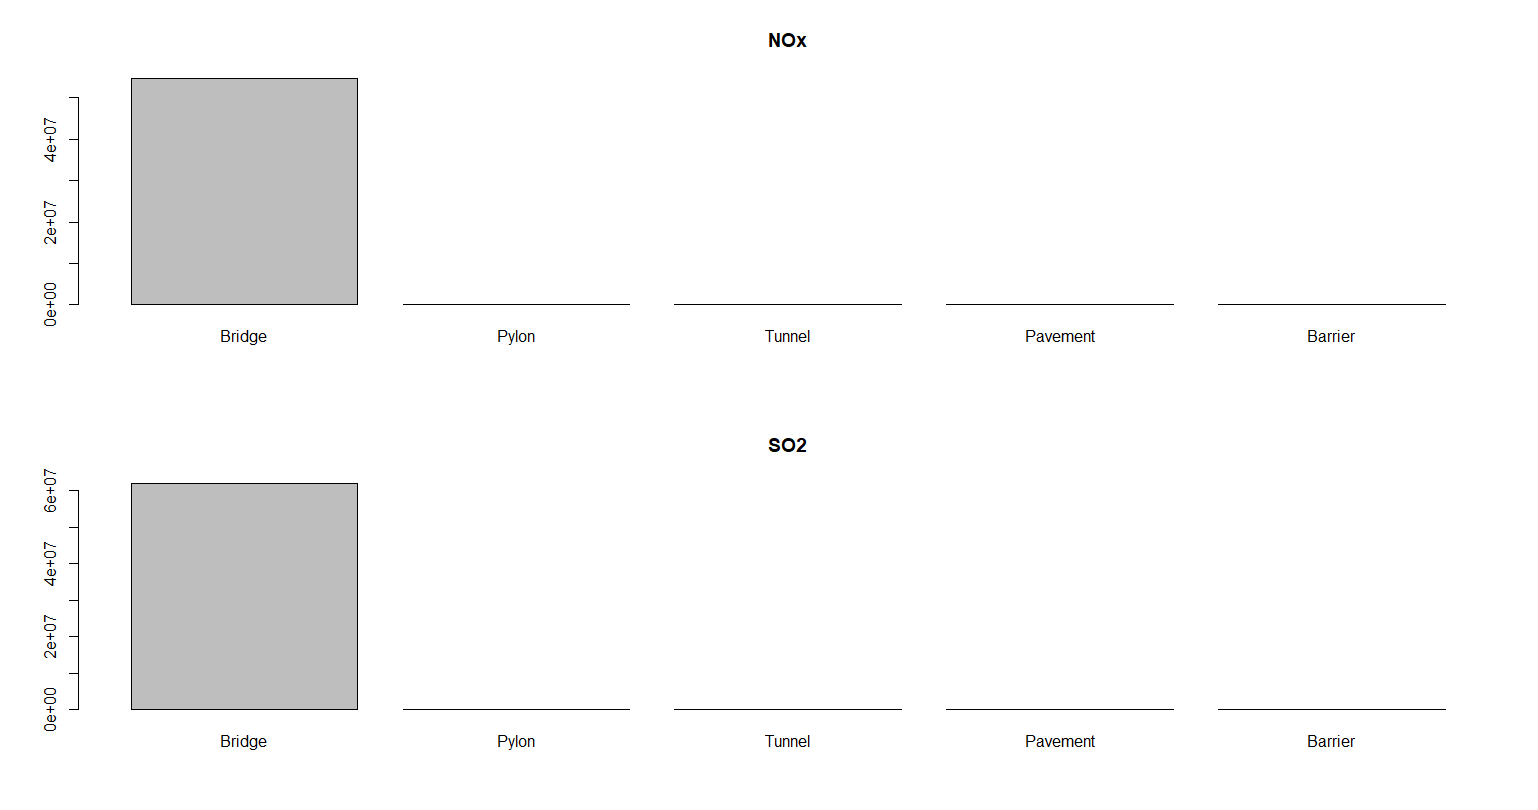
Figure 1 – LCA of each subsystem
The distribution of each indicator for the best five strategy options are shown in Figure 2 below. There is no strategy option that is significantly showing the best impact on the environment but it can be identified that strategy option 4 has for all four indicators the lowest values.
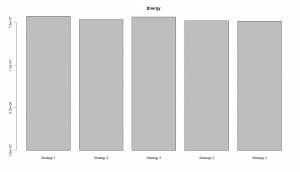
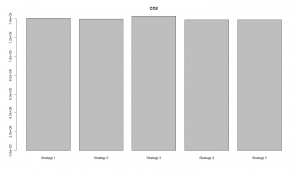
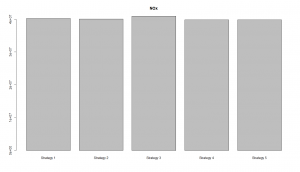
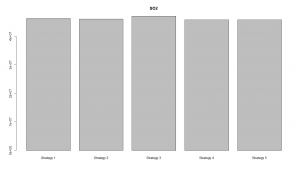
Figure 2 – LCA results for five strategy options
Another way of showing the results of the LCA is done with a radar plot (Figure 3). The comparison can be better conducted since it is more visible which strategy options have more or less impact on the environment.
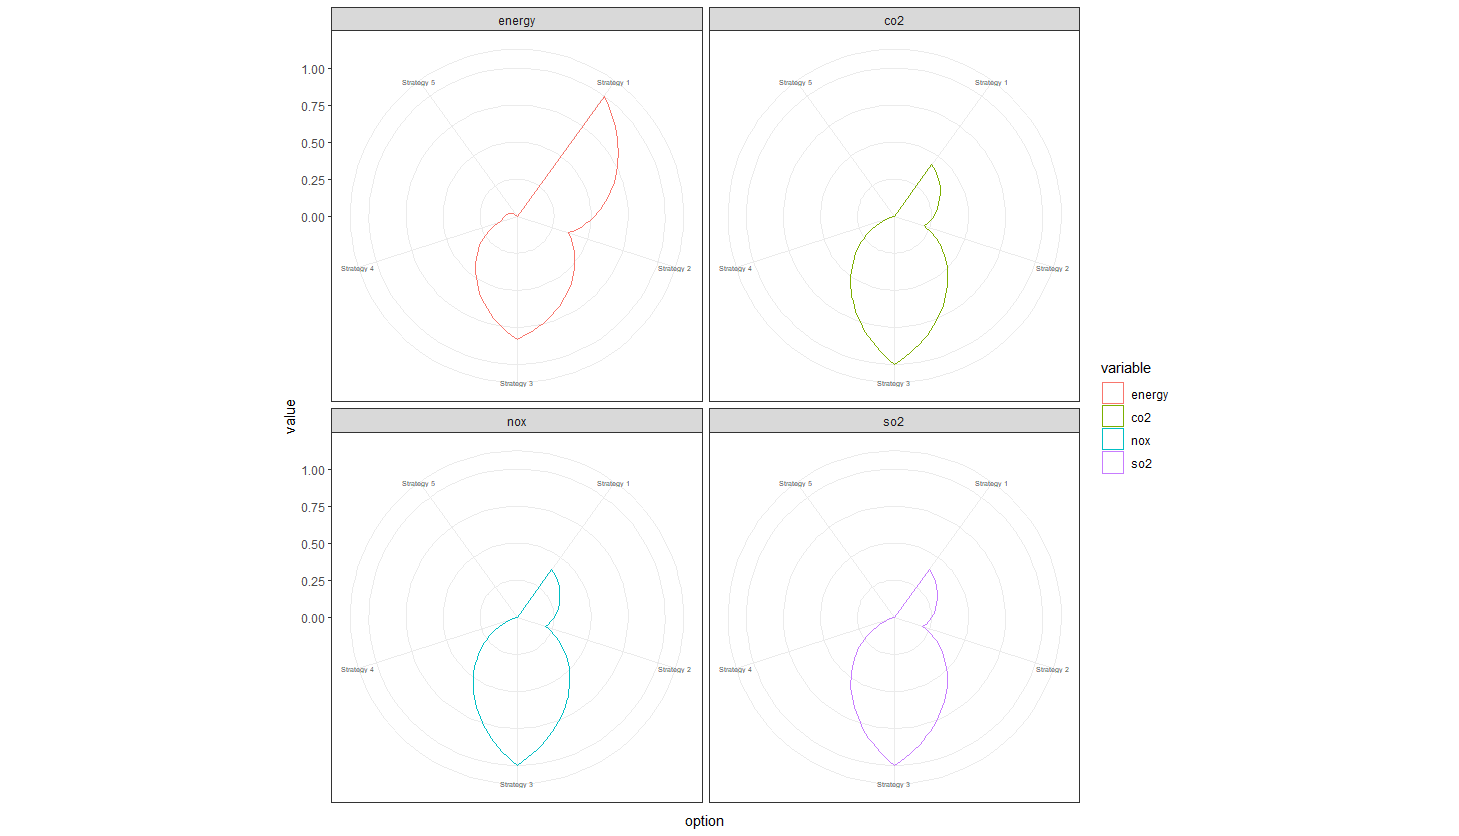 Figure 3 – Radar plot of LCA results
Until now, we only discussed the performance data of the integrated system and its subsystems after conducting the LCA. However, having multiple performance criteria on hand, we improve our model by using the Analytic hierarchy process (AHP) method which is one of the multicriteria decision making (MCDM) methods.
First, a score matrix for each performance criteria is developed based on the LCA results.
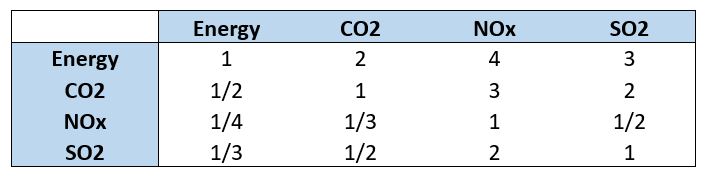
Table 3 – AHP – Pairwise comparison of the criteria
After performing AHP in R we pie chart plot of the AHP results, which is shown in Figure 4. The conclusion of our MCDM based AHP model clearly indicates that strategy option 4 is the most suitable and high multi performing design option with 33,5 %.
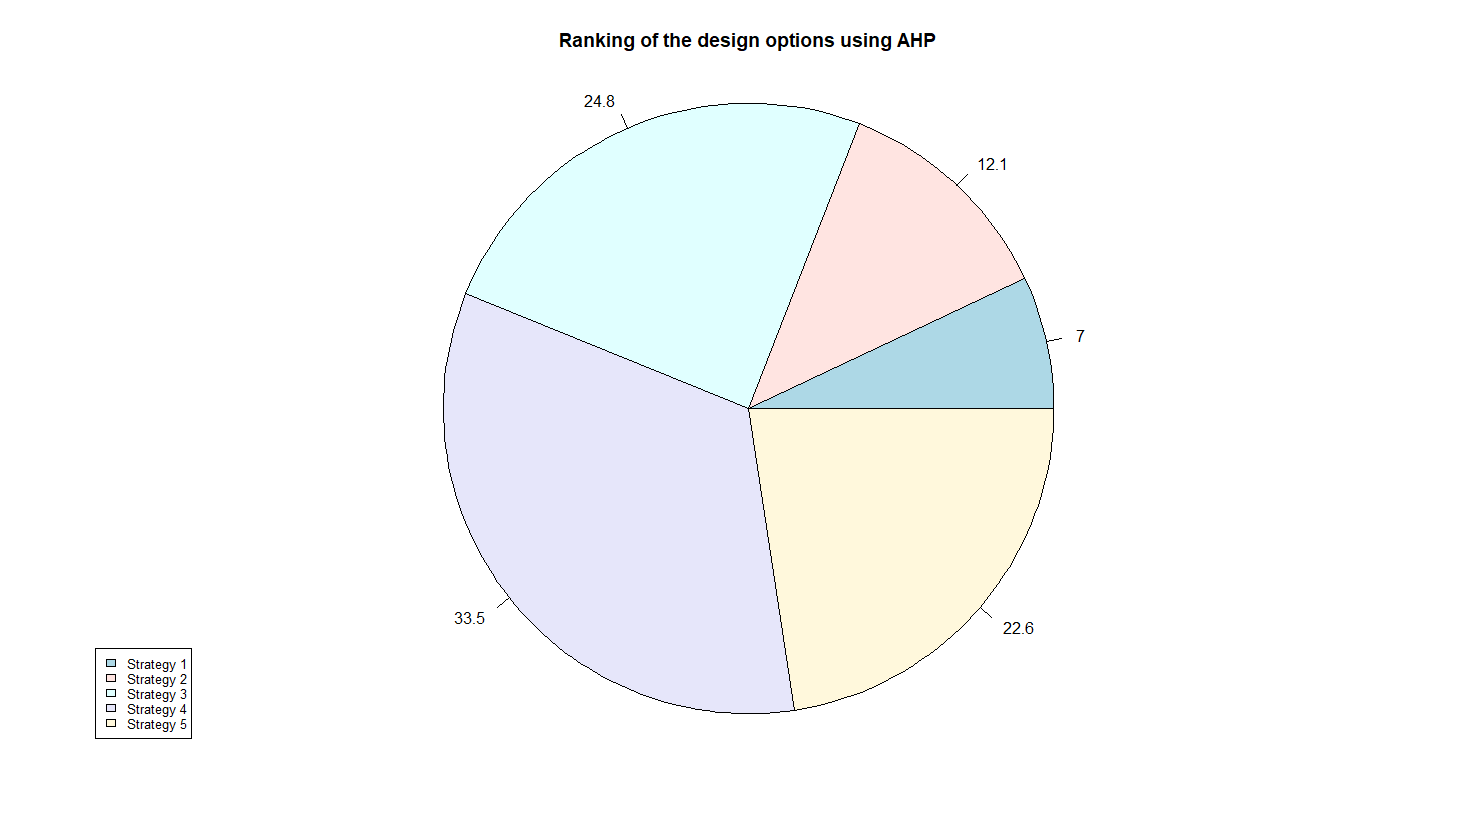
Figure 4 – AHP results
As the last part in the LCA, we take a look on the environmental cost. The costs for the five strategy options are visible in Figure 5. Here, the cost for each indicator has been summed up, thus these results show the total environmental impact of the strategy options. Strategy option 3 and 5 show the lowest cost followed by strategy option 4. By taking into account the above-conducted AHP results, strategy option 4 would be the best choice for the stakeholder since it would lead to the lowest environmental impacts and environmental costs.
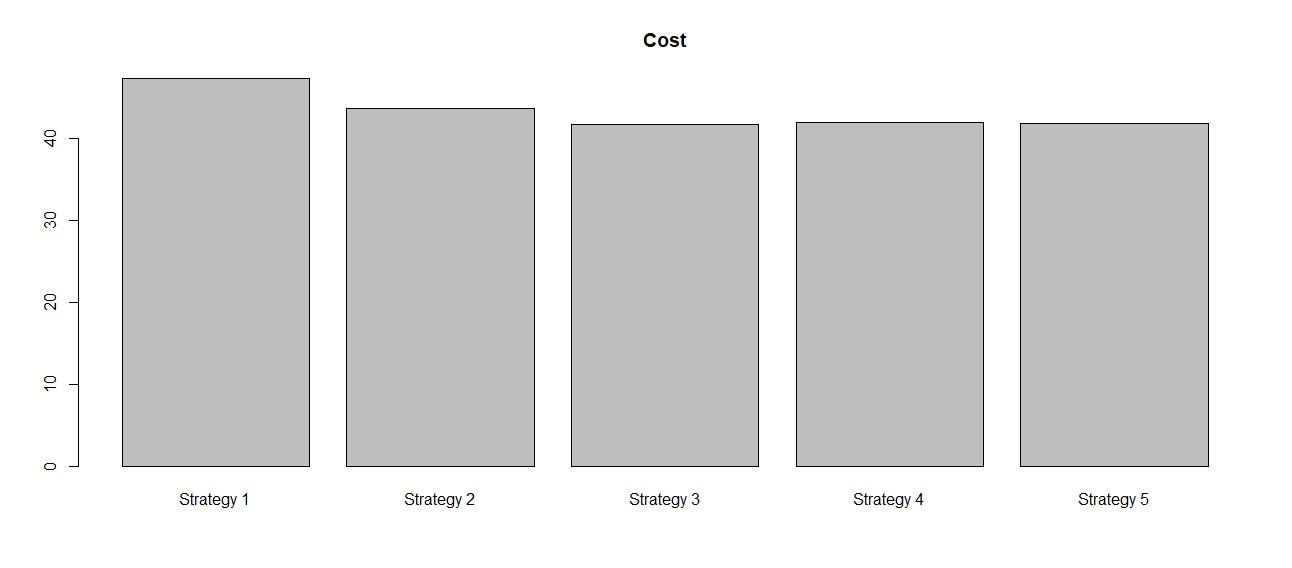
Figure 5 – Environmental cost of each strategy option
Go to page: Multi-Objective Optimization