Goal and Scope
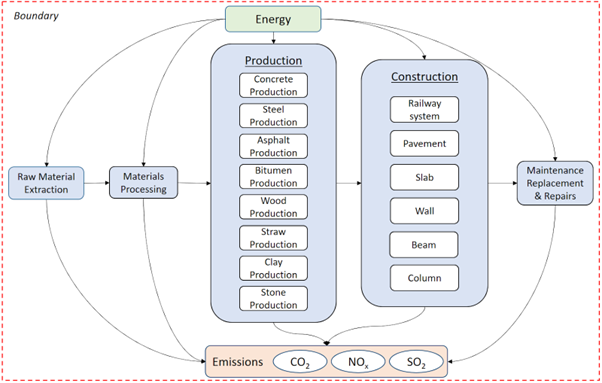
The analysis boundary encompasses the raw material extraction, material preparation and processing, and maintenance. The energy and emissions from each system are quantified and analyzed in the integrated R script.
For our analysis, we choose a cradle to gate approach, shown by the following graphic:
Life Cycle Inventory
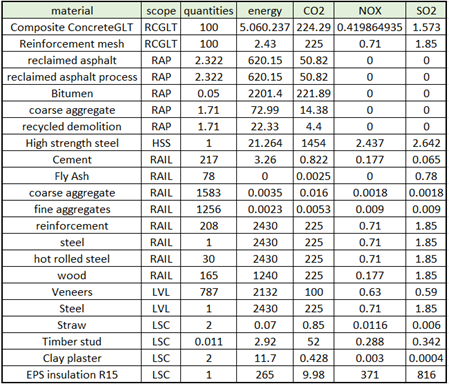
In order to combine the inventories of all materials and emissions for all systems, we decided to create one matrix function for each; each system would be represented by an “if” loop that called that particular system’s scope from a combined CSV file. The material quantities, energy consumed, and emissions produced would then be concatenated into a matrix for that subsystem. For this to work, we ensured that all quantities had the same units, particularly the materials which we adjusted to have the same functional unit of one cubic meter.
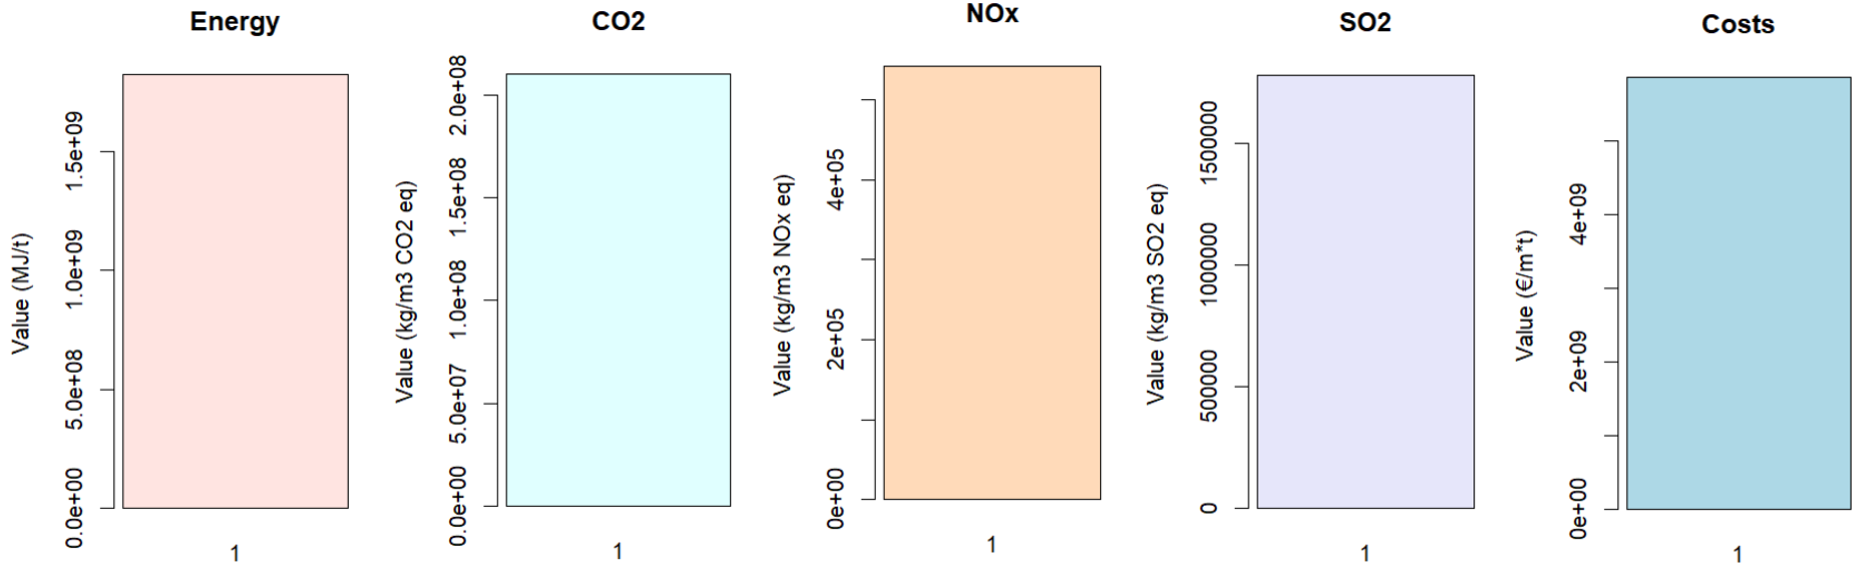
This process resulted in six different matrixes for each of our individual systems. In the final part of the inventory section, we combined all six matrixes into one integrated system that essentially totaled up all values from the subsystems into one single row matrix. The costs for energy and each type of emission was also included in this matrix, represented by the combined quantities from the integrated matrix multiplied by the unit cost per metric ton of emission produced. Quantities from the matrix are visually presented in the bar plots below: