Introduction
In this assignment, an innovative inspection method is used to assess the condition of the Pipe. Reliable pipe degradation models are critical for achieving a good balance between maintenance costs and system performance in pipeline network systems, which are an important component of civil infrastructure. A pipe serves as a path for water. Pipes come in a variety of sizes and are thus made of a variety of materials. The primary function of a pipeline is to transport water from one point to residences or commercial establishments. For this assignment, we will conduct a life cycle analysis on pipes and their deterioration over time. Pipes have been around for a long time. Pipe materials have evolved alongside technology, resulting in a diverse range of materials that are almost all still present in the ground today. Each has its own set of maintenance requirements, characteristics, and lifespans.
Pipe Sub-systems
- Concrete Pipe
- Cast Iron
- Fiber-Reinforced Polymer
- Reinforced Concrete Pipe is the most common type of concrete sewer pipe. Steel reinforcement bars (rebar) run lengthwise through the center of the pipe to create RCP. The rebar strengthens and stabilizes the pipe, making it ideal for high-pressure applications.
- Cast iron pipes are extremely strong and capable of supporting over 4,800 pounds per linear foot. Because of the density of cast iron, these pipes also aid in noise reduction, which is especially important in high-rise buildings and hotels. Cast iron is also fire resistant, which is an important consideration for any home or structure. Despite these benefits, cast iron pipes have a limited lifespan.
- Fiber Reinforced Polymer Types Polymer Reinforced with Glass Fibers Glass fibers is created by combining silica sand, limestone, folic acid, and a few other minor ingredients. At around 1260°C, the mixture is heated until it melts.
Defining Goal and scope
For this project, we have chosen the pipe materials as the sub-system. As the materials of pipes are improving and new materials are getting introduced for the construction of pipes as it can affect the life span and the quality of the Pipe, therefore we are only considering the materials used. This project conducts a Life cycle assessment on the materials used in Pipes.
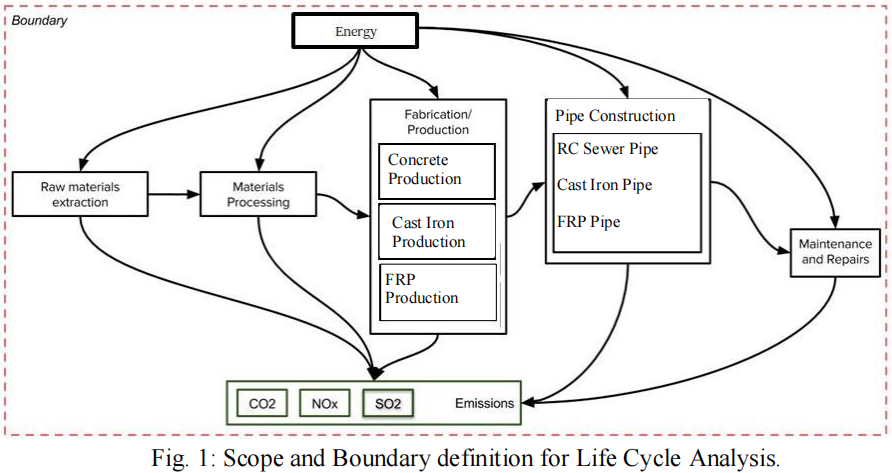
This scope is defined to make design engineers decide on the energy and emission factors for each material used in designing the Pipe.
Design Options
We have three different design options for this analysis. Fig. 2 shows the different design options used for the analysis and Table 2 describes the three different design options.
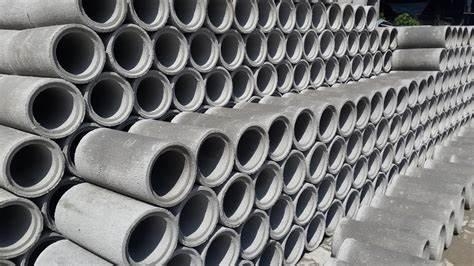
Concrete Pipe
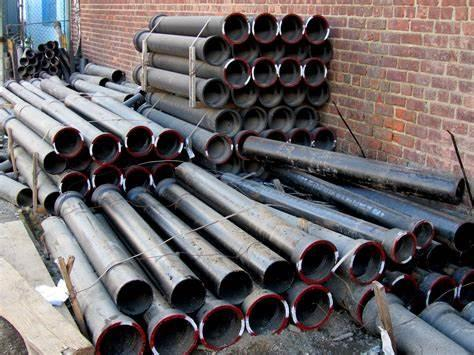
Cast Iron Pipe
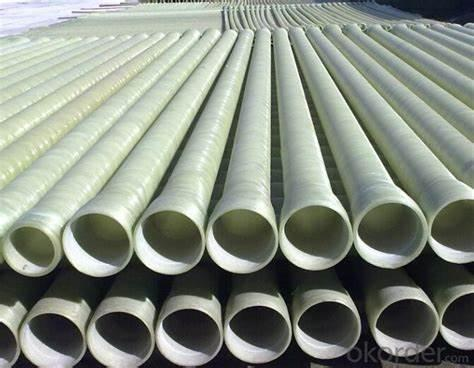
Fiber Reinforced Polymer
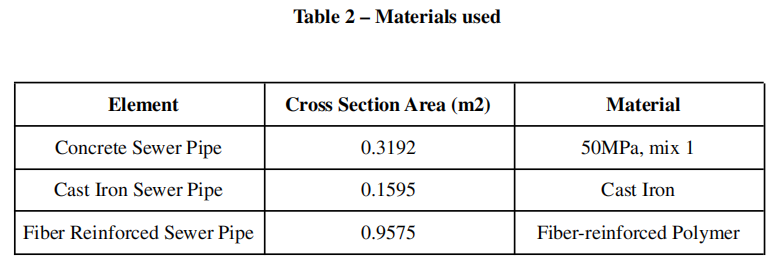
Table 2 represents the different materials and its properties used in this analysis.
Life Cycle Inventory
Table 3 represents the composition of different materials used in this project. The table shows information regarding energy consumption, CO2, NOX, and SO2.
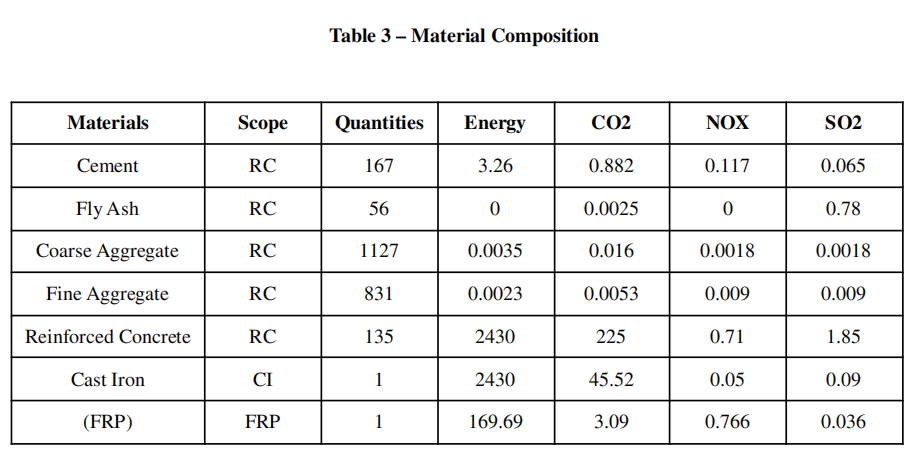
Here RC – Reinforced Concrete, CI – Cast Iron and FRP – Fiber Reinforced Polymer. The energy for each material is in MJ/t. The quantity for RC and FRP represents 1m3 of concrete and Cast Iron in Kg respectively, for the corresponding energy and emissions.
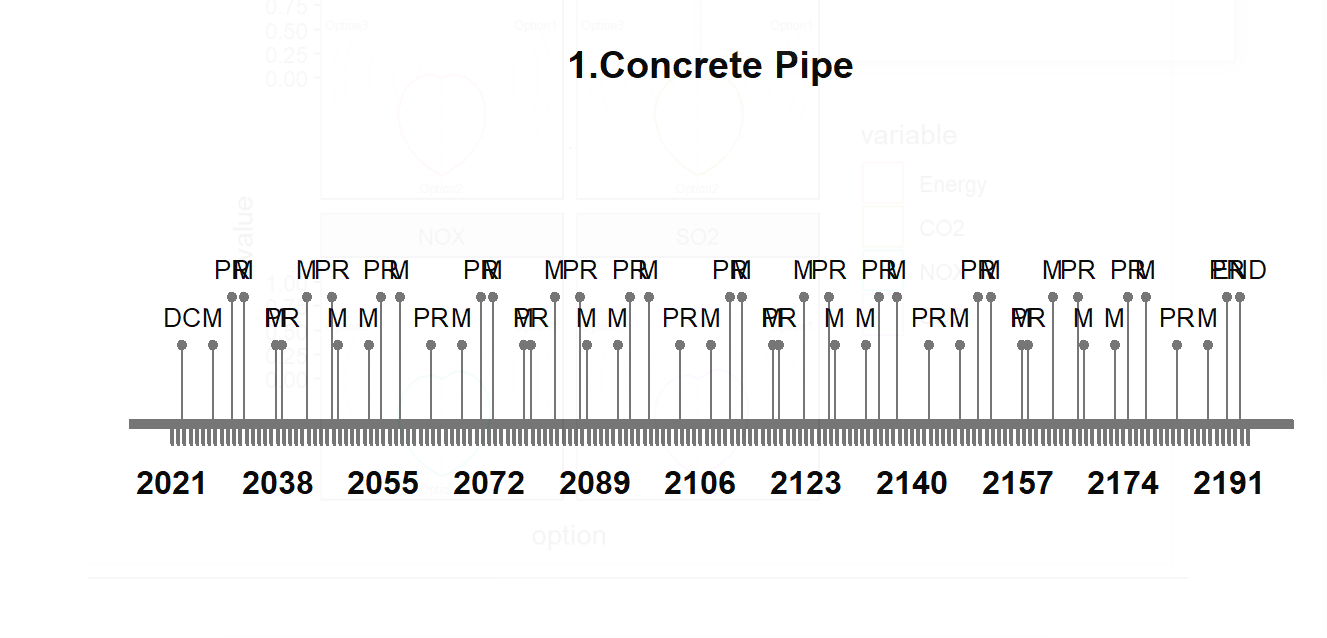
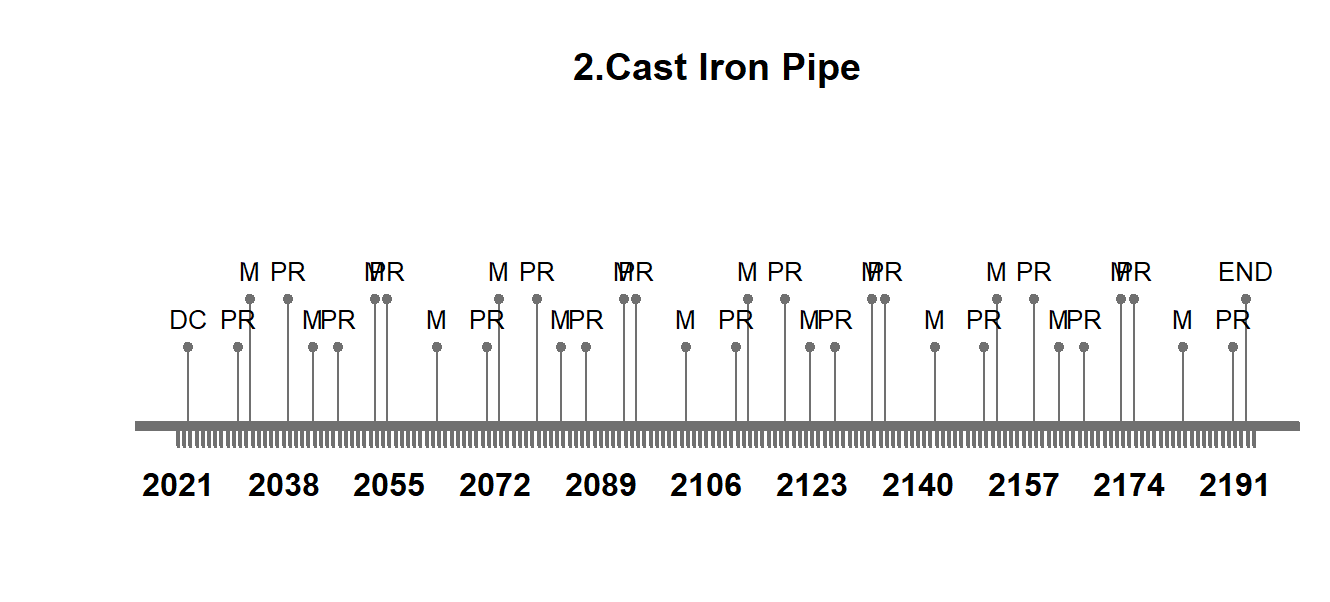
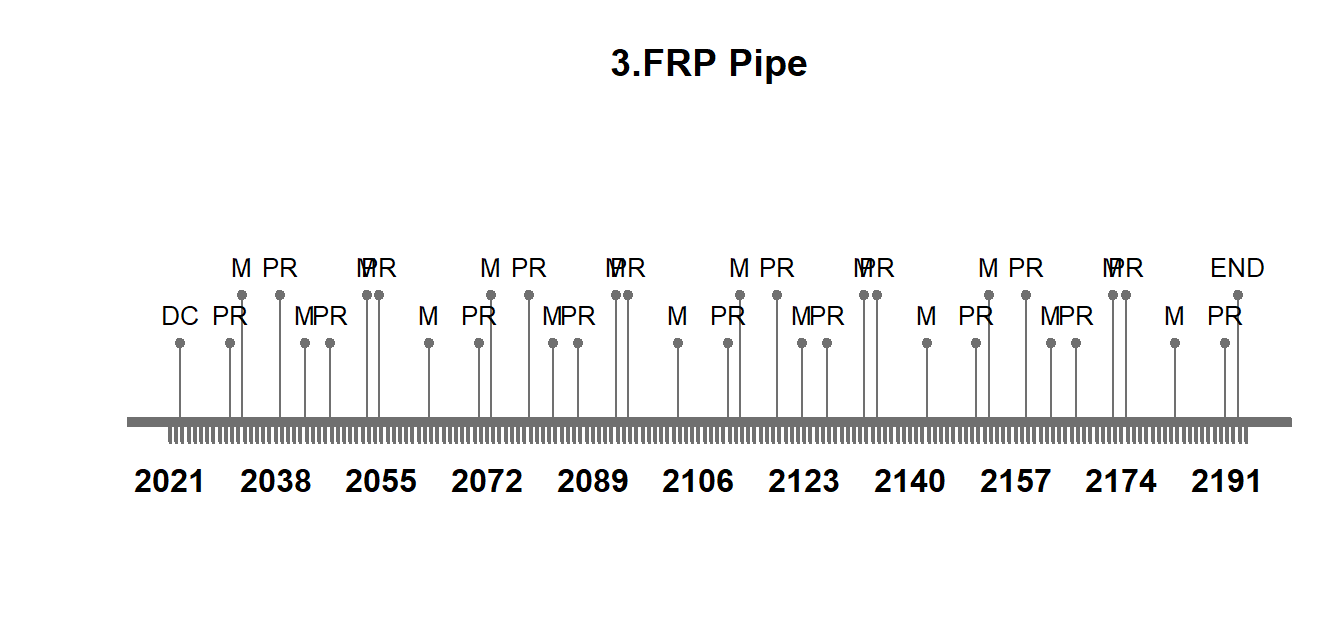
Life-Cycle Timeline
For the construction of the timeline we will use the following maintenance interventions as given below
Option 1 – PR = 8 years, M = 5 years
Option 2 – PR = 8 years, M = 10 years
Option 3 – PR = 8 years, M = 10 years
Here PR – Pipe Replacement and M – Maintenance.
We have assigned 01-01-2023 as the start date of the construction. The lifespan of the system is 170 years. The generated timeline for the Options is shown below.
Life Cycle Inventory Analysis
The Life Cycle Inventory Analysis for the three Options is done and the corresponding results are obtained and presented in the figures below.
As we look at Fig. 3 we can see the energy consumption of each design option. For Option 1, i.e. Pipe with an FRP requires the least energy of around 5000 MJ/t for the manufacturing and fabrication of materials, then the most energy is required by Cast Iron Pipe.
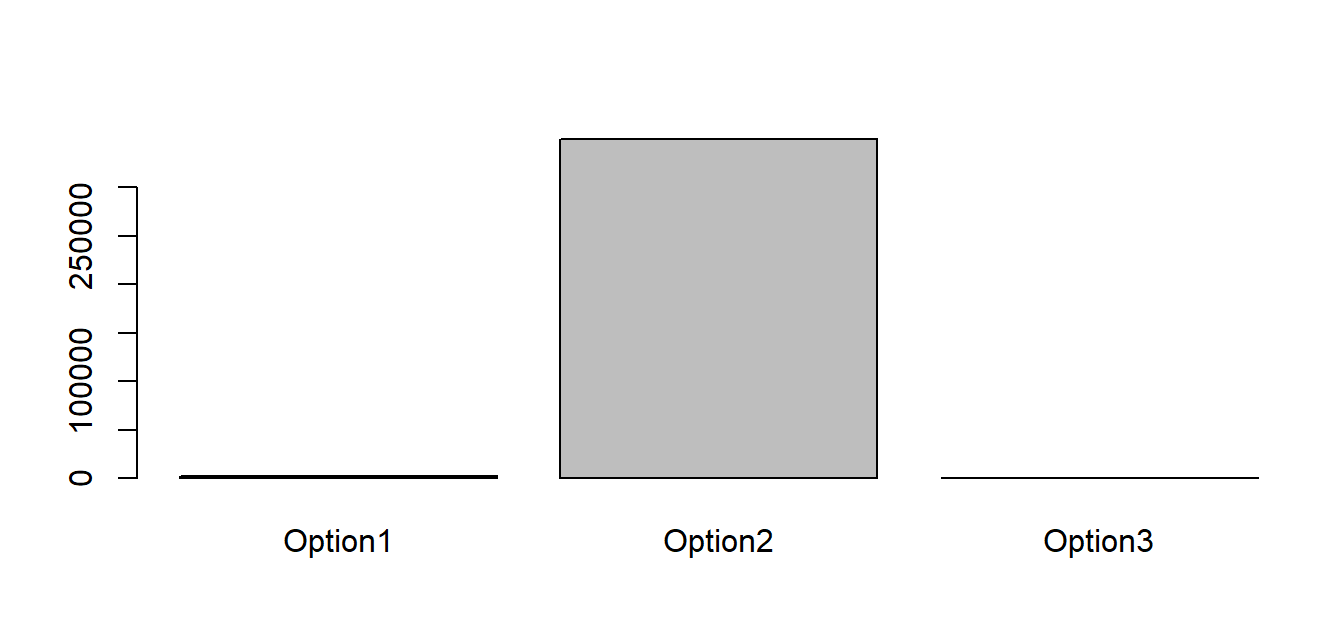
Fig. 3: Energy Consumption for different design options
Fig. 4 represents the CO2 emission for each design option and the Pipe of FRP (Option 3) has the least emission, Cast Iron Pipe with the highest emission.
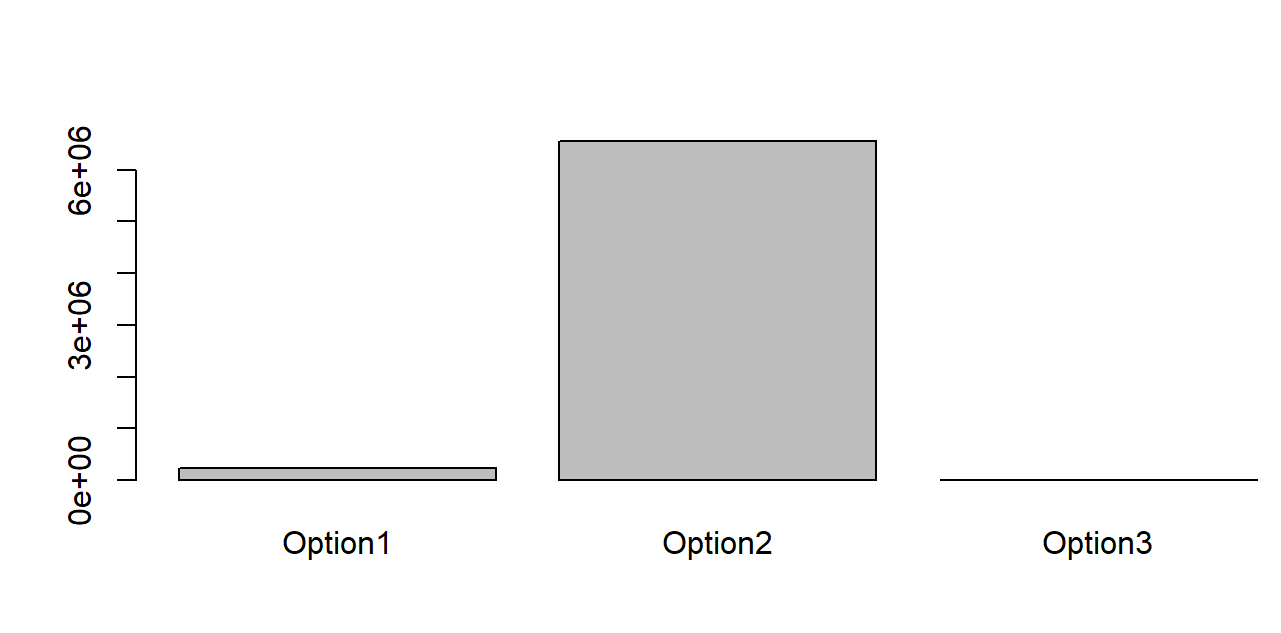
Fig. 4: CO2 Emission for different design options
In Fig. 5 also, the NOx emission for FRP is the least, and Cast Iron has the highest value.
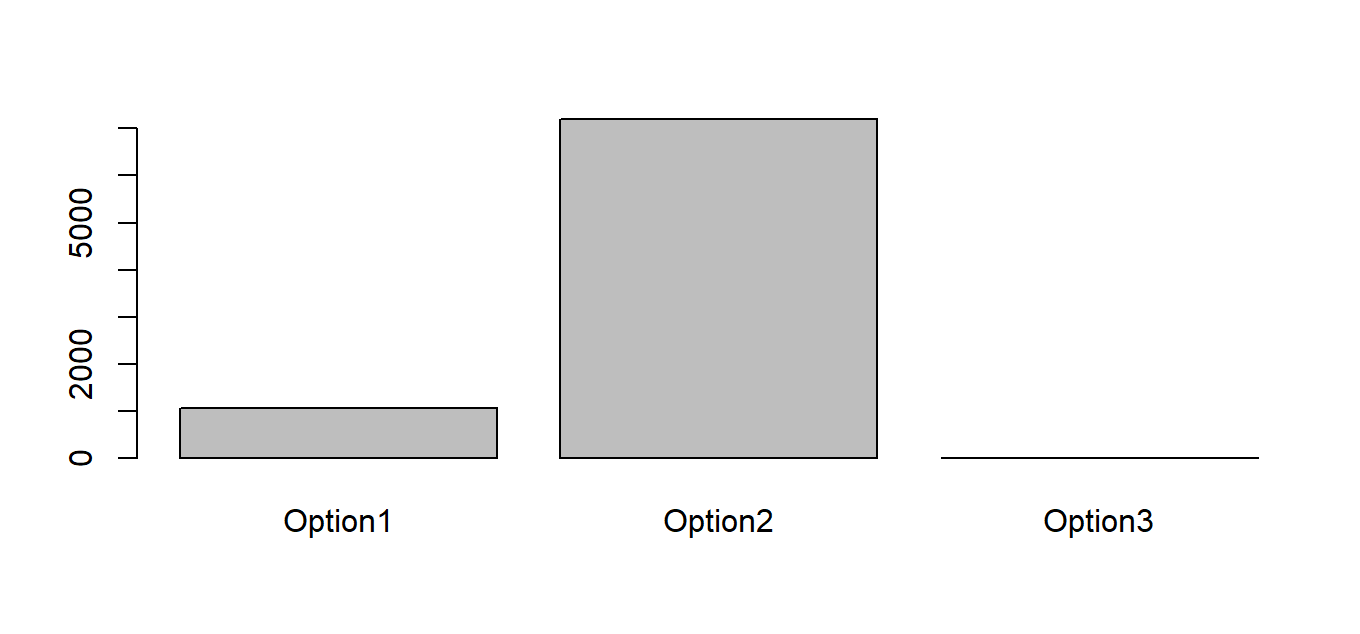
Fig. 5: NOx emission for different design options
In Fig. 6 FRP has the least emission. In fact, when we compare all 4 graphs the least energy and emission is by FRP. This can help decide that Fiber Reinforced Polymer (FRP) is one of the best options for Pipes.
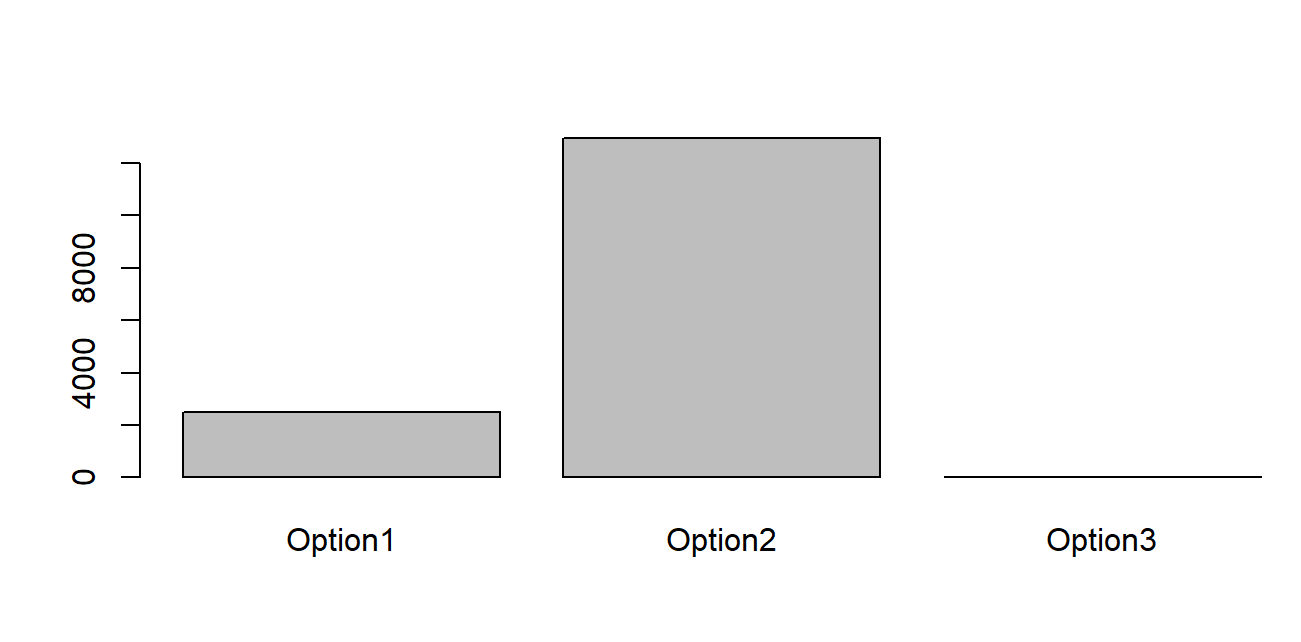
Fig. 6: SOX emission for different design options
Fig. 7 shows the radar plot with reinforced concrete as the best. But this alone will not help the decision-making. Now let’s do some multi-criteria decision analysis.
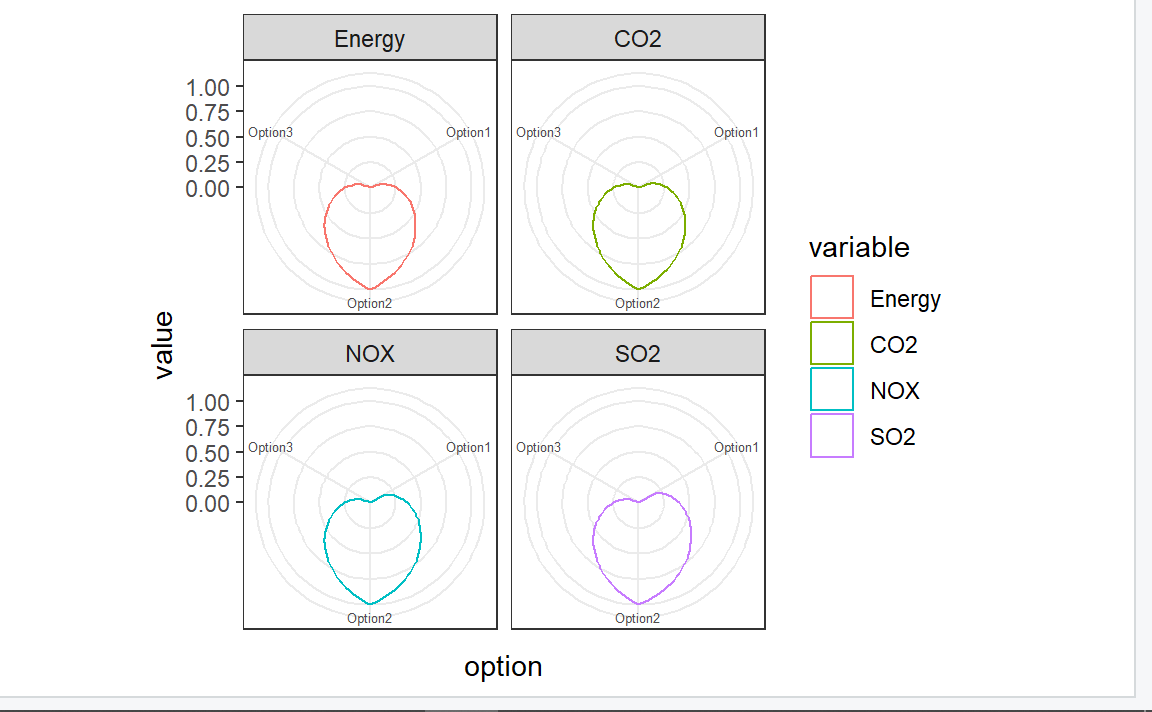
Fig. 7: Radar plot for the different indicators
MCDA – TOPSIS
Let’s use the TOPSIS method to analyze the system for this model. TOPSIS is a straightforward ranking method in both conception and implementation. The standard TOPSIS method attempts to select alternatives that are both the closest to the positive ideal solution and the furthest away from the negative ideal solution. The positive ideal solution maximizes the benefit criteria while decreasing the cost criteria, whereas the negative ideal solution decreases the benefit criteria while increasing the cost criteria.
Let’s define the weights for each indicator as follows
➔ Energy – 35%, CO2 – 25%, NOx – 25%, SO2 – 15%
For TOPSIS 1st method we decide the criteria to be minimum for all the indicators.
TOPSIS 2 nd method works on comparison to ideal solution. For this, we will define the scores for a positive and negative solutions.
For positive ideal solution – Energy – 0.11, CO2 – 0.12, NOx – 0.15, SO2 – 0.05
For negative ideal solution – Energy – 0.5, CO2 – 0.75, NOx – 0.5, SO2 – 0.85
After conducting the TOPSIS analysis the resulting rankings are shown in Fig. 8 and Fig. 9
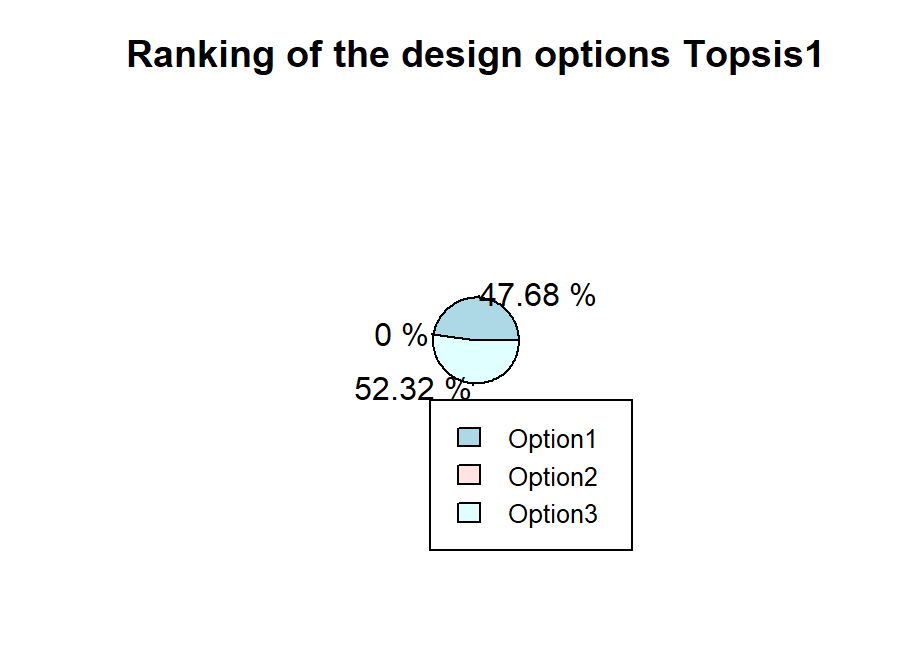
Fig. 8 Ranking of Design Option TOPSIS 1
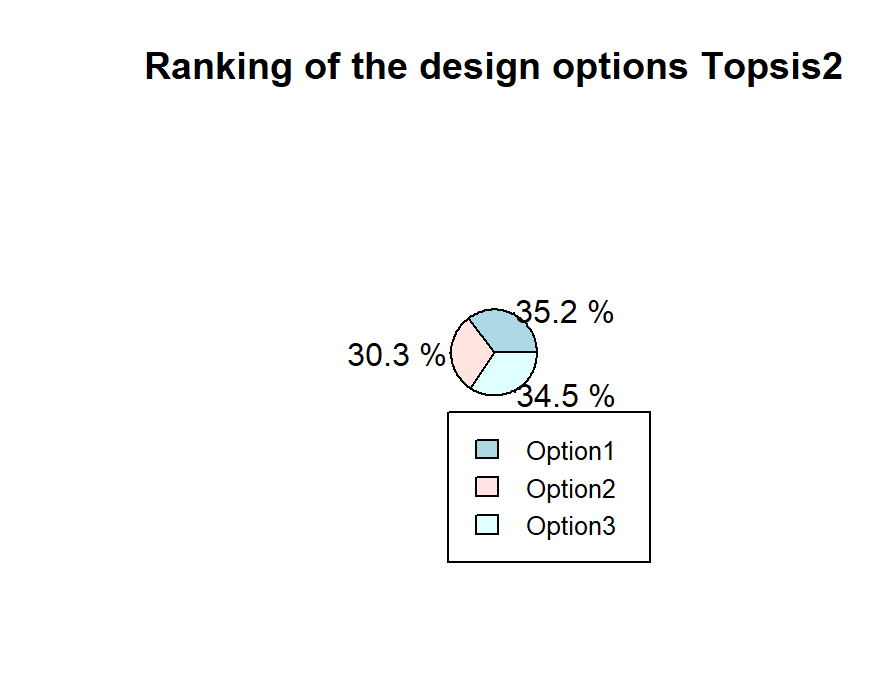
Fig. 8 Ranking of Design Option TOPSIS 2
These results strongly support for Option 3 (Fiber Reinforced Polymer). In the first TOPSIS analysis, we get Option 3 with the highest ranking of 52.32%, but in the second TOPSIS analysis, we have all three options with almost the same ranking, with Option 1 being the highest with 35.2% followed by Option 3 with 34.5 % and Option 2 with 30.3%.
Conclusion
After conducting all of the various analyses for the Pipeline system, we can conclude that Option 3 (Fiber Reinforced Polymer) is the best option for the Pipes. Fiber Reinforced Polymer (FRP) had the lowest emission and energy requirements in the life cycle inventory analysis for all of the different energy and emission criteria; even the TOPSIS ranking favored Fiber Reinforced Polymer. These analyses can be used by an engineer to choose the best option for the construction of sewer pipe. However, other factors such as structural strength, durability, and so on should be considered before making this decision. The Option for Cast Iron can be used to save money, but the emissions and energy requirements are higher.
References
- https://www.sketchup3dconstruction.com/const/determine-the-weight-of-an-iron-pipe.html
- https://www.sciencedirect.com/science/article/abs/pii/S0959652619319432
- https://www.sciencedirect.com/science/article/abs/pii/S0959652619319432
- https://link.springer.com/article/10.1007/s10098-014-0849-x
- https://www.sciencedirect.com/science/article/abs/pii/S0964830598000493casa_token=nL9u4z35ojMAAAAA:cLf19uO4K8XRtGQcC5zwYHQs5yd0toZgtKk4-GewCsQ0JQE3u2UWnKP123qlU6t8vmCFSrHg4Q
- https://ascelibrary.org/doi/abs/10.1061/41203(425)20