System: Bored piles | Subsystem / Component – Piling Concrete
My system focused on the bored piling system, particularly bearing piles, for bridge foundations. Concrete’s composition and complexity, including additives and replacement materials, are outlined. Selecting the appropriate mix is crucial, considering factors like project scope, soil conditions, and resource availability. Constraints, such as steel density and environmental concerns, impact material selection. Time for strength development, workability, and sustainability are also key considerations, often requiring trade-offs for optimal solutions.
Goal and scope of the study
Goas of the LCA analysis was to introduce a quantitative framework for evaluating the environmental sustainability of different concrete mix designs for piling systems. It focuses on comparing the environmental impact of three concrete mix options: conventional piling, piling without groundwater, and piling with stabilizing fluids. The study’s scope includes the initial life cycle phases, production processes, transportation, and on-site construction of bored piles. Unlike traditional approaches, it also incorporates the use phase, maintenance, and repairs, assuming potential deterioration requiring intervention. The functional unit is 1 m³ of concrete, reflecting the quantity needed for casting bored piles with a defined service life and mechanical load.
Regarding the scope of the LCA, the system boundaries are presented in Figure 1.
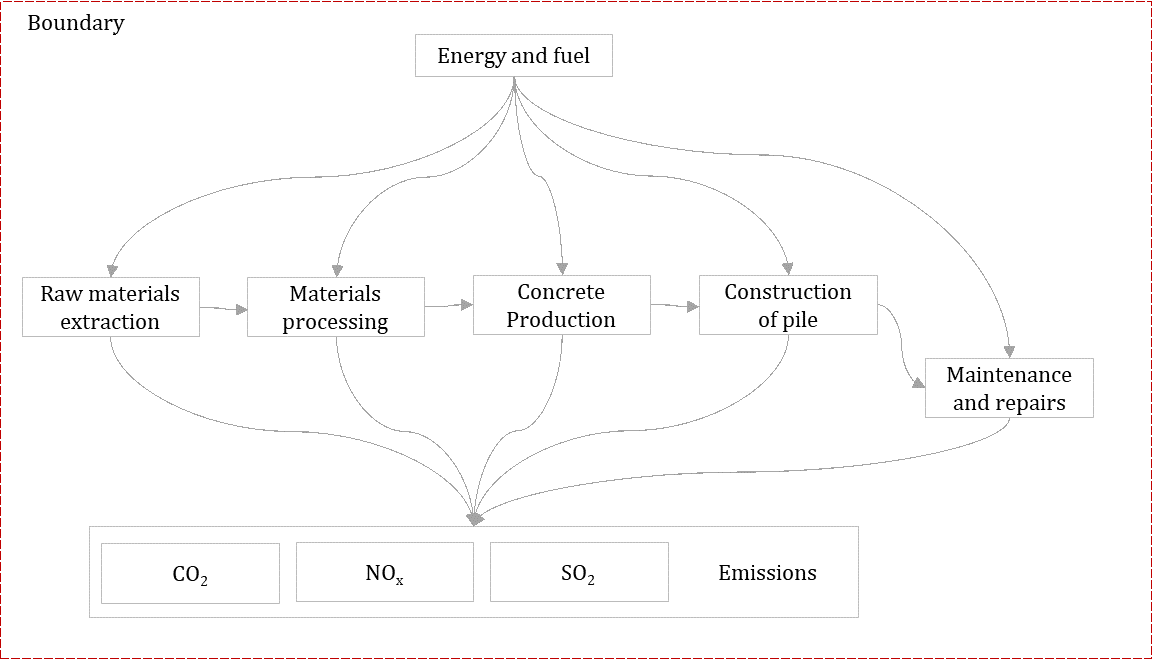
Figure 1. Scope of the LCA.
Design alternatives and concrete design mixtures
The three concrete mix designs undergoing LCA are summarized in Table 1.
Figure 2 shows a sketch of the bored pile considered in the study.
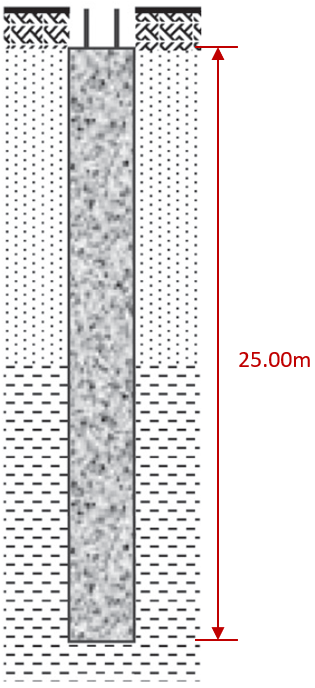
Figure 2. The bored pile of our system
Table 1. The three design options of the study
| Design option | Piling Material | Dimension (Area x Depth) |
| Option 1 – Conventional without water | Ready Mix 1 | Diameter: 0.90 mDepth: 25.0 m |
| Option 2 – conventional with water | Ready Mix 2 | |
| Option 3 – With stabilizing fluid | Ready Mix 3 |
In this study the data were collected associated with the energy consumption for fabrication and processing (MJ/t), CO2, NOx, SO2 (kg/m3) and presented in Table 2.
Table 2. Material content of each concrete mix design the main substances emitted to air (in kg) [1], [2], [3], [4], [5]
| DesignOption | Material | Quantity [kg/m³] | Energy | CO2 | NOx | SO2 |
| 1 | Cement II/A | 330 | 3.192 | 0.586 | 0.00157 | 0.00012 |
| 1 | Fly ash | 35 | 0.833 | 0.95 | 0.0019775 | 0.00454 |
| 1 | Aggregates | 1720 | 0,018457 | 0.0000728 | 0.000597 | 0.0000467 |
| 1 | Admixtures | 9.4 | 16 | 0.720 | 0.0018 | 0.0036 |
| 2 | Cement III/A | 365 | 1.587 | 0.222 | 0.00051 | 0.00051 |
| 2 | Fly ash | 35 | 0.833 | 0.95 | 0.0019775 | 0.00454 |
| 2 | Aggregates | 1642 | 0,018457 | 0.0000728 | 0.000597 | 0.0000467 |
| 2 | Admixtures | 8.2 | 16 | 0.720 | 0.0018 | 0.0036 |
| 3 | Cement I | 200 | 4.094 | 0.810 | 0.002 | 0.0006 |
| 3 | GGBFS Blast furnace slag | 200 | 1.58 | 0.849 | 0.00010015 | 0.000341 |
| 3 | Aggregates | 1751 | 0,018457 | 0.0000728 | 0.000597 | 0.0000467 |
| 3 | Admixtures | 4.40 | 16 | 0.720 | 0.0018 | 0.0036 |
Life cycle timeline
System lifespan with interventions
In the Figure 3 – Figure 5 are visualized the system lifespan with interventions for the three concrete design mixes investigated.
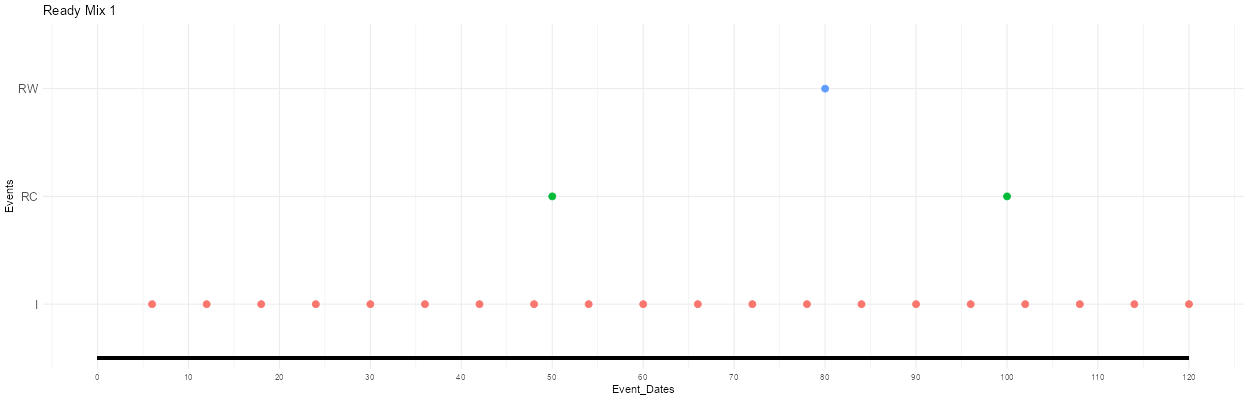
Figure 3. System lifespan with interventions for the Ready mix 1 concrete design mix
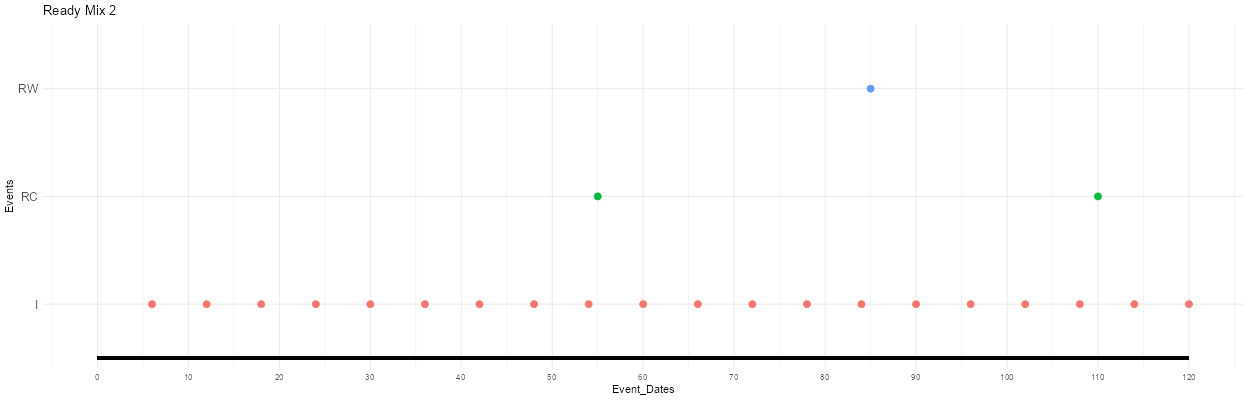
Figure 4. System lifespan with interventions for the Ready mix 2 concrete design mix
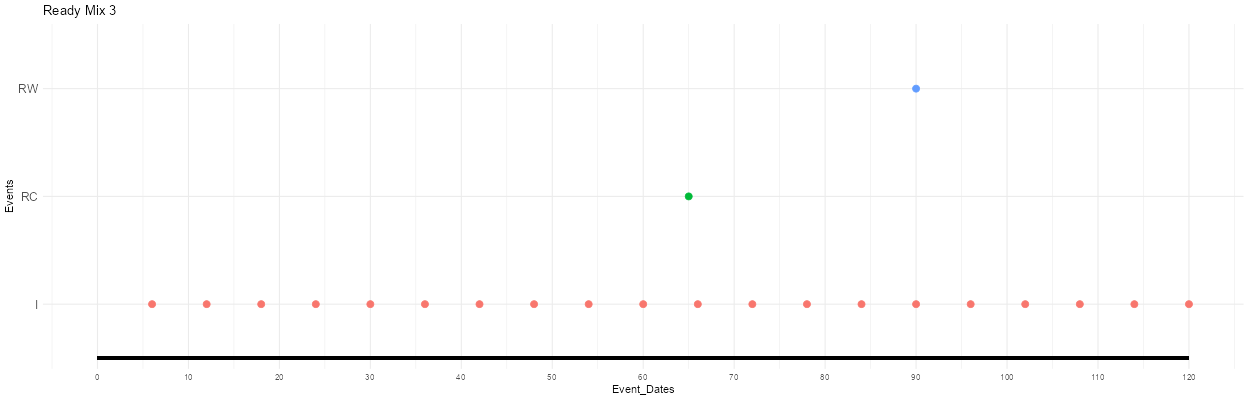
Figure 5. System lifespan with interventions for the Ready mix 3 concrete design mix
Life Cycle Inventory and Analysis
The characterization of each category comparatively displays impacts associated with each mix design and are shown in Figure 6 – Figure 9. The comparison of the of the three concrete mix designs in terms of energy consumption, CO2, NOx, SO2 emissions reveals significant differences.
Ready Mix 1 exhibits high energy consumption, while Ready Mix 2 displays the lowest. However, Ready Mix 2 has favorable CO2 emissions due to its low Portland cement content. Ready Mix 3 shows the highest CO2 emissions but falls in between the others for energy consumption. Regarding NOx emissions, Ready Mix 3 has the highest impact, followed by Ready Mix 2 and then Ready Mix 1 with the lowest. Ready Mix 2 also exhibits the highest SO2 emissions, while Ready Mix 1 has the lowest, and Ready Mix 3 falls in between.
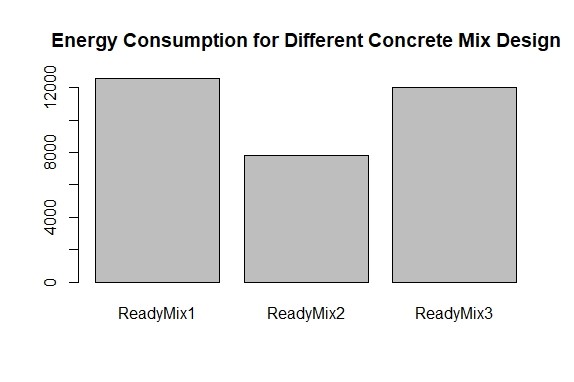
Figure 6. Energy consumption for the three concrete mix designs
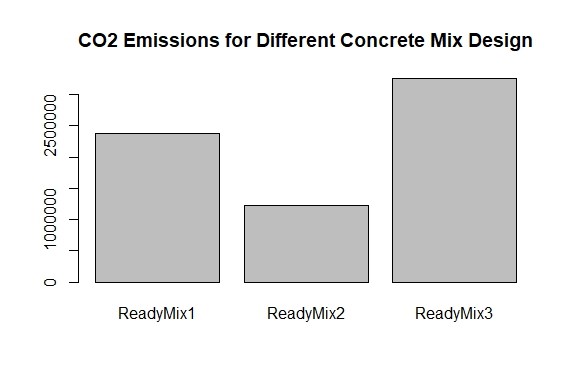
Figure 7. CO2 emissions for the three concrete mix designs
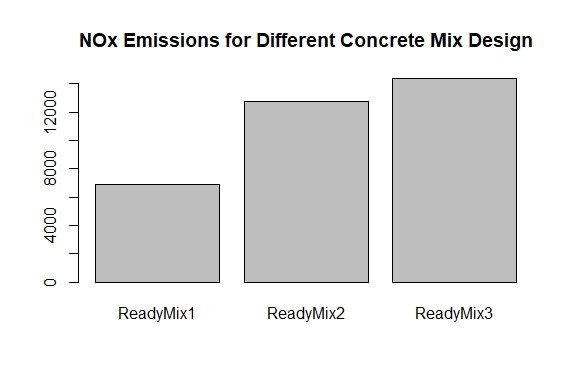
Figure 8. NOx emissions for the three concrete mix designs
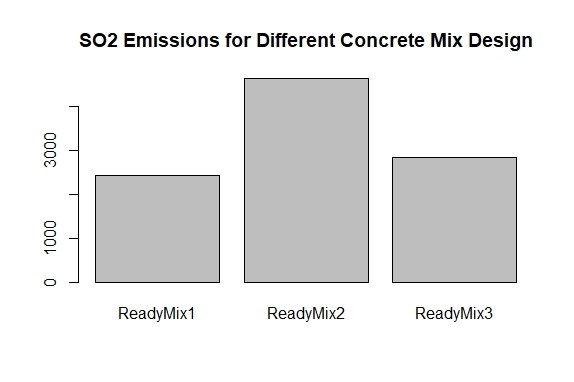
Figure 9. SO2 emissions for the three concrete mix designs
MCDM – Analytic hierarchy process (AHP)
Pairwise Comparisons
This section employs Saaty’s 1-9 scale to prioritize CO2 emissions and energy consumption over NOx and SO2 emissions. Table 3 outlines the priority levels for pairwise comparisons. Energy and CO2 emissions receive higher importance (30% and 50%, respectively), while NOx and SO2 are assigned lower priority (10% each). By integrating these priorities into the Analytic Hierarchy Process (AHP), Figure 10 ranks concrete design mixes. Surprisingly, Ready Mix 1 emerges as the top choice, contradicting expectations based solely on production processes.
Table 3. Level of priority in the study for the pairwise comparison
| Energy | CO2 | NOx | SO2 |
| 30% | 50% | 10% | 10% |
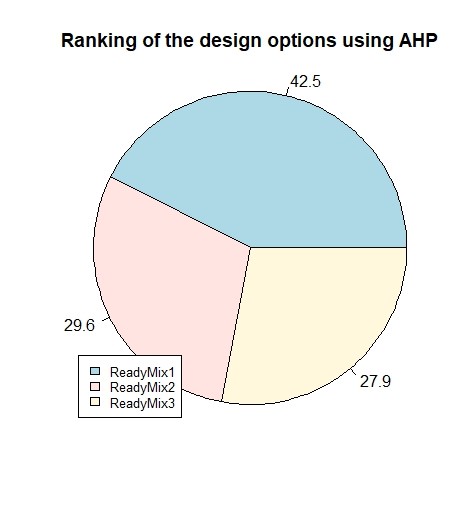
Figure 10. Ranking of the design options
References
[1] G. Habert, J. B. d’Espinose De Lacaillerie, und N. Roussel, „An environmental evaluation of geopolymer based concrete production: reviewing current research trends“, J. Clean. Prod., Bd. 19, Nr. 11, S. 1229–1238, Juli 2011, doi: 10.1016/j.jclepro.2011.03.012.
[2] A. Josa, A. Aguado, A. Heino, E. Byars, und A. Cardim, „Comparative analysis of available life cycle inventories of cement in the EU“, Cem. Concr. Res., Bd. 34, Nr. 8, S. 1313–1320, Aug. 2004, doi: 10.1016/j.cemconres.2003.12.020.
[3] A. Josa, A. Aguado, A. Cardim, und E. Byars, „Comparative analysis of the life cycle impact assessment of available cement inventories in the EU“, Cem. Concr. Res., Bd. 37, Nr. 5, S. 781–788, Mai 2007, doi: 10.1016/j.cemconres.2007.02.004.
[4] P. Van Den Heede und N. De Belie, „Environmental impact and life cycle assessment (LCA) of traditional and ‘green’ concretes: Literature review and theoretical calculations“, Cem. Concr. Compos., Bd. 34, Nr. 4, S. 431–442, Apr. 2012, doi: 10.1016/j.cemconcomp.2012.01.004.
[5] J. Sjunnesson, „Life Cycle Assessment of Concrete“, 2005.