A Life Cycle Analysis (LCA) gives ideally a good prediction and on the system environmental impact over its entire lifetime.
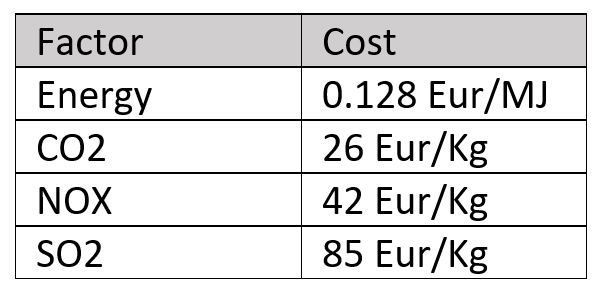
In this case we are focussing on three systems a hangar, a runway and the foundation, that are part of an airport and are interacting with each other in different ways. For the LCA we are taking the total consumption or energy, CO2, NOx and S02 into account and will measure their value by assigning a certain cost to ort the different emissions and the energy consumption.
In order to conduct the LCA it was necessary to create a function that calculates the required quantities of raw materials and determent the final emissions and the energy consumption for the whole system that has been used during the mere construction and the maintenance.
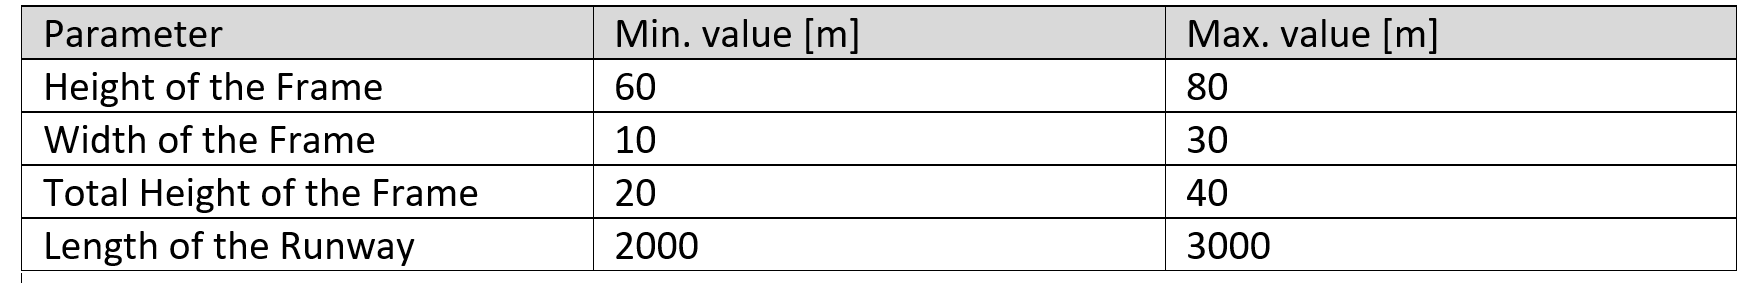
- Height of the Frame
- Width of the Frame
- Total Height of the Frame
- Length of the Runway
In the following we are using a step scaling the step scaling analysis to visualise and to analyse our systems. The domains for our different parameters are the following:
Two different scenarios are presented for either steel frame (see Hangar) PCC (see Runway) with Bottom 1 (see Bottom Plate) or a timber frame with HMA and bottom1.
Steel Frame PCC Bottom1
It can be seen in fig. 1 and fig 2 that for all systems except the seating the cost rises simultaneously with the higher values for the input parameter. So generally, it can be said that we do have a almost linear rising const for almost all systems relative to the input parameters. The most dominant cost factor in terms of the systems is the runaway cost.
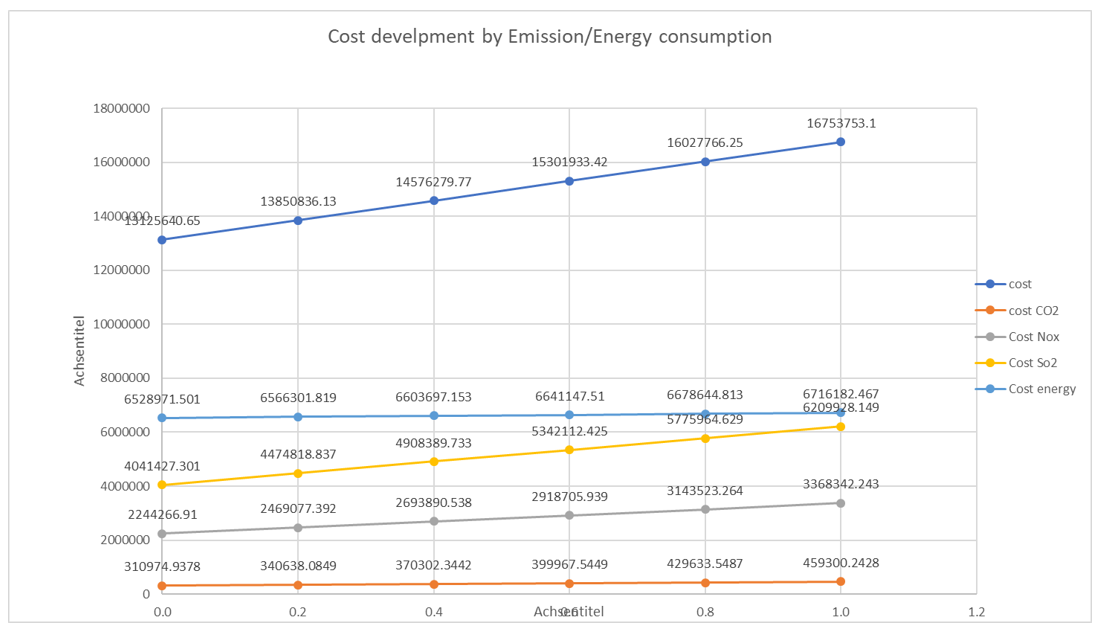
In terms of the emissions and energy consumption in fig. 2 it can be seen, that all factors rise with increasing parameters. The most dominant factor here is the energy cost.
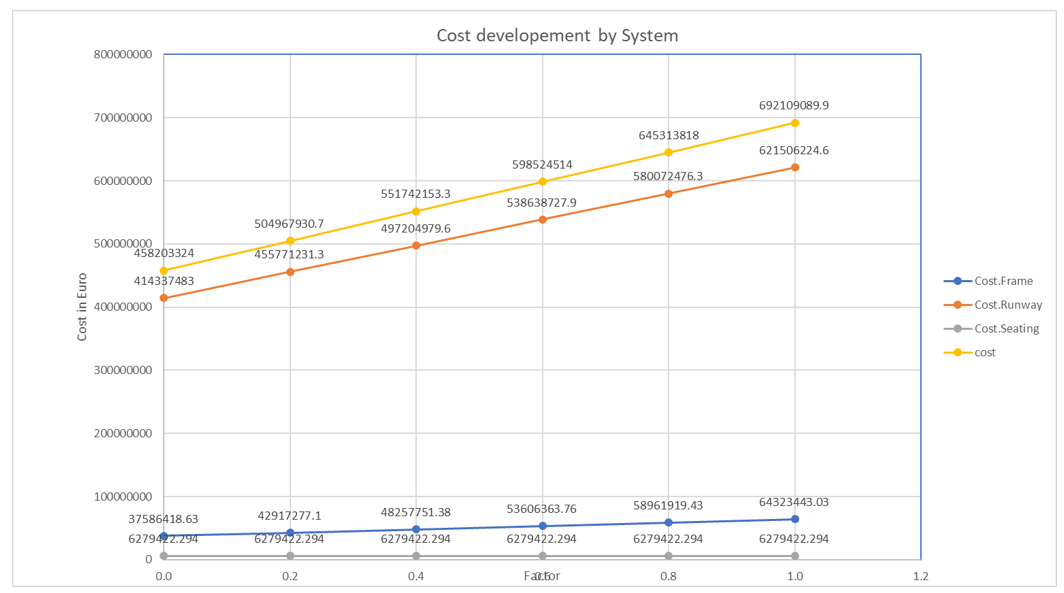
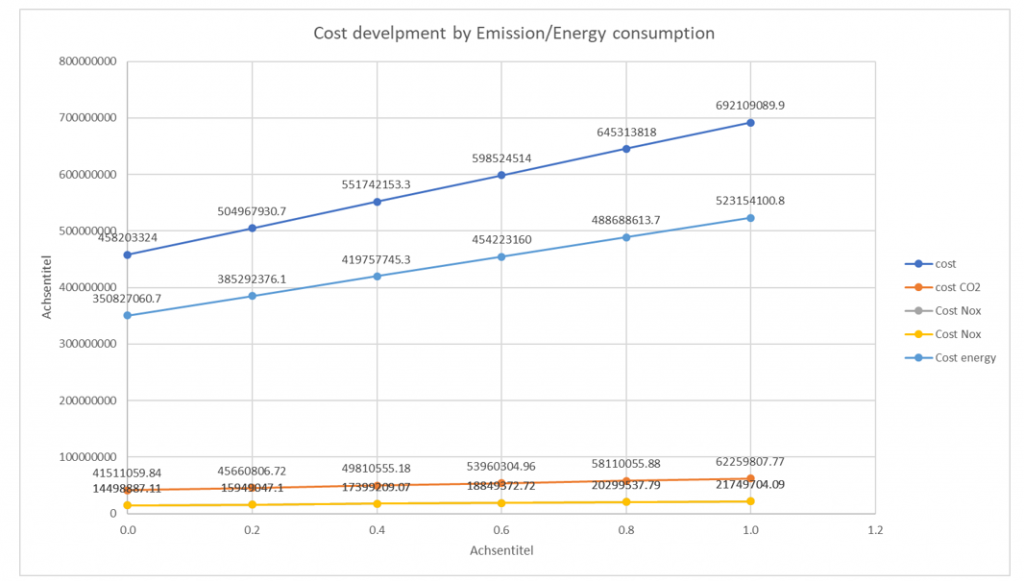
Fig 2: Cost developement divided emission/ energy consumption
Timber Frame HMA Bottom1
Fig. 3 shows the cost development of cost in relation of different systems. The cost for seatings do not vary at all while all other systems behave in a linear manner additionally it can be seen that the Runway do exceed the seating cost eventually.
In Fig.4 Shows the cost development regarding to the different emissions or the energy consumption. All do behave in a linear manner as well with energy cost being the strongest factor within the given ranges.
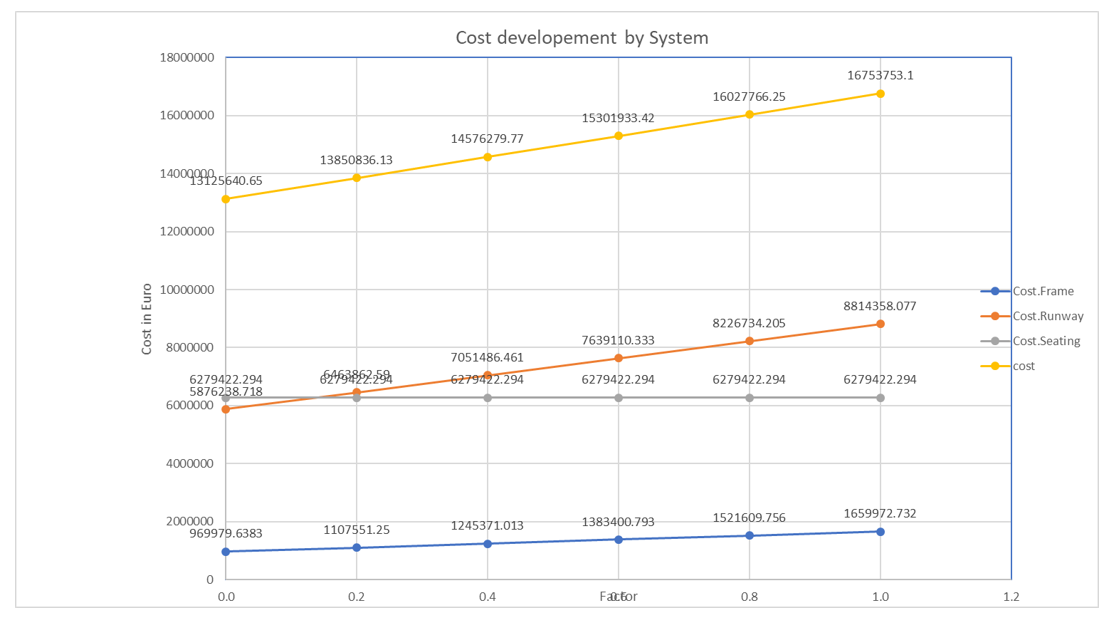
Concluding we can say that if we want to influence the total cost of the system it makes sense for both cases to focus on the runway as a major cost factor since it plays a dominant role in both cases and has a large variety on the given domain.
Also it is worth mentioning that our model is only working with a fix cost per unit for CO2, SO2, NOX and energy. These values might change significantly due do for example CO2 taxation.