1.System deterioration during lifetime
Background.
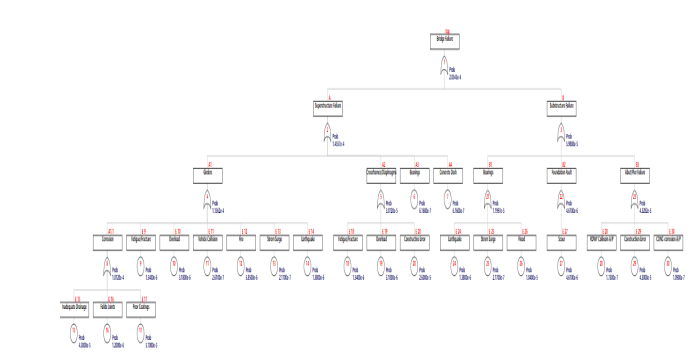
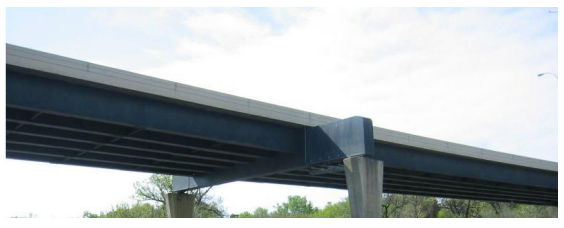
This is in USA a Foot and Cycle Path Steel girder Bridge which have six lanes. And analyze the bridge’s deterioration and possibility of failure. Two categories of methods can be used to develop bridge deterioration models, deterministic and stochastic methods. The deterministic model assumes that the bridge deterioration tendency is certain, so regression analysis is commonly used to determine the decay rate . We usually use Fault tree to caculate possibility of failure. The use of FTA as a risk assessment method for bridge collapse was found to bean improvement on current risk analysis methods, however, it is not a replacement. It is best used in combination with visual inspections and SHM sensors. The added benefits of FTA are its ability to identify initiating events to bridge failure through assessment of bridge components and their relationships to one another. It also has the advantage of being capable of assessing internal bridge components. These aspects make the qualitative analysis component of FTA a great tool for determining the initiating bridge failure events. In addition, this Paper also shows Mean time to failure (MTTF) and mean time to repair (MTTR) and Value of information.
Steel girder Bridge deterioration modelling
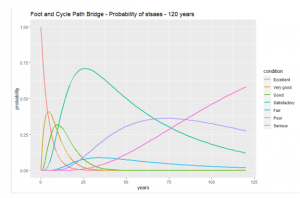
Through this graph, we can know that the first intervention plan is ten years later, and the bridge will most likely be in a good state after ten years. Moreover, once the bridge reaches a good condition, the probability of moving to a satisfactory condition increases, and it will reach its peak after 25 years. Therefore, managers need to start maintenance work after ten years to maintain the possibility of good condition. After 75 years, the probability that the state of the bridge is poor will reach its peak. If there is no intervention of any kind, the life expectancy of the bridge will be 70-80. At this time, the bridge should be closed for major maintenance.
Steel girder Bridge failure modeling
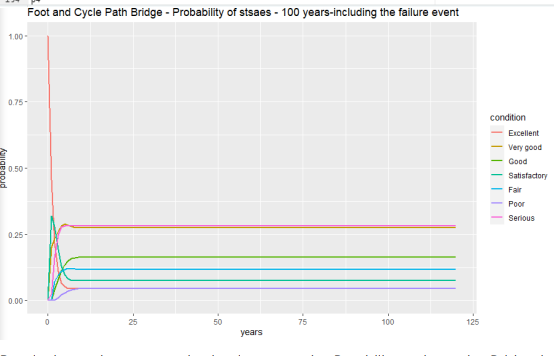
We come to the final conclusion by combining fault trees.
Result shows that our repair plan increases the Proability to keep the Bridge in “Excellent”. In this time Engineers can relax the maintenance plan in order to reduce costs
Mean time to failure (MTTF) and mean time to repair (MTTR)
Based on information we can calculate the failure rate.
The conclusion is that if event F occurs, we will carry out repairs, if event F can be predicted not to happen, we will not carry out repairs
2Life-Cycle Analysis and Multi-Criteria Decision Analysis
Background
Foot and cycle path bridge in the United States as an example. The bridge is rated as a class 3 bridge with a predicted service life of 50 years. The bridge uses steel girder, reinforced concrete pillars, asphalt pavement, and the road width is 10 meters. A total of Six lanes. I specifically do a life cycle analysis of its pavement.We used three different scenarios to predict the bridge’s life time, energy consumption and emission of harmful substances. We analyzed timeline, Life Cycle Inventory and Analysis, MCDM – Analytic hierarchy process (AHP)
and MCDA – TOPSIS.
.Life-Cycle timeline.
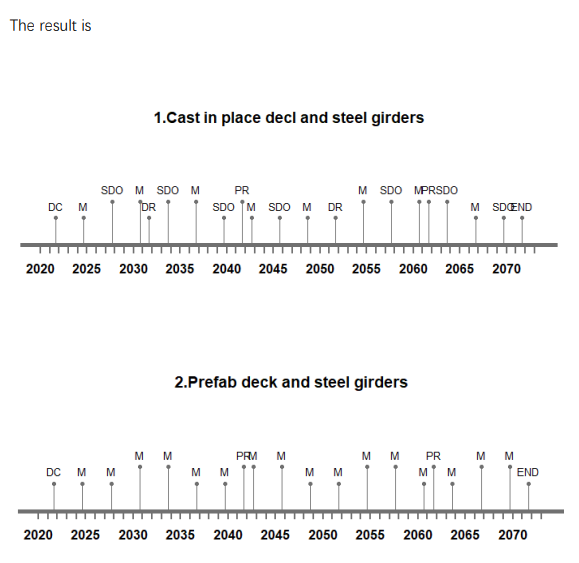
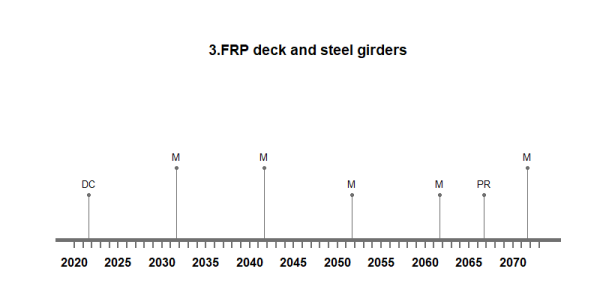
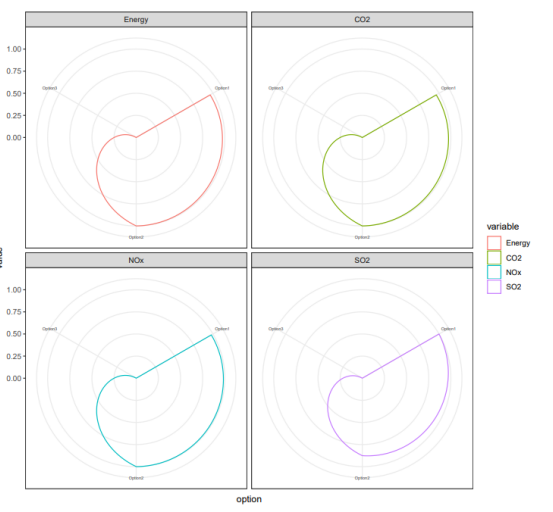
In the analysis of Energy consumption, So2, Co2, No emissions, the data of Option 1 and Option 2 are similar, but the energy consumption and harmful gas emissions of Option 3 are very low. Therefore, only from the environment In terms of insurance, there is no doubt that Option3 is the best choice. But based on the analysis of the first part, considering the cost, it is again difficult for me to decide which Option to use.
MCDM – Analytic hierarchy process (AHP)
As the next multi-criteria decision analysis method, we will implement this method through a preference ordering technique similar to the ideal solution. We will start implementing this method by defining the weights for each criterion.


Topsis1 shows that Option3 has the highest weight ratio. For the ideal solution, it is also shown in Topsis2 that Option3 has a slight advantage over the other two solutions. Opton3 considers Energy, SO2.CO2, NOX and other aspects. The proportion of environmental protection is the highest. In the analysis of the first and second parts, the later maintenance cost and environmental burden of Option 3 are the best. The analysis results of the third part are the same as the first and second parts. Therefore, in the construction of this road, considering the later maintenance cost and environmental protection, FRP concrete should be selected to construct the surface layer