1.Introduction
By the end of 2021, the total mileage of highway in the country has reached 5,280,700 km, of which 1,356,000 km will be in the stage of preventive maintenance and 1,652,000 km will be in need of reparative maintenance (Liu et al. 2023). This enormous scale of road network intensifies the need for a comprehensive understanding of the life-cycle environmental impacts. The objective is to apply the LCA methodology to evaluate the environmental impact of these pavement alternatives and compare their sustainability performance focusing on their energy consumption and atmospheric emissions. The life-cycle analysis and multi-criteria decision making using AHP approach is conducted in this assignment for the environmental impact evaluation.
2. Goal and Scope
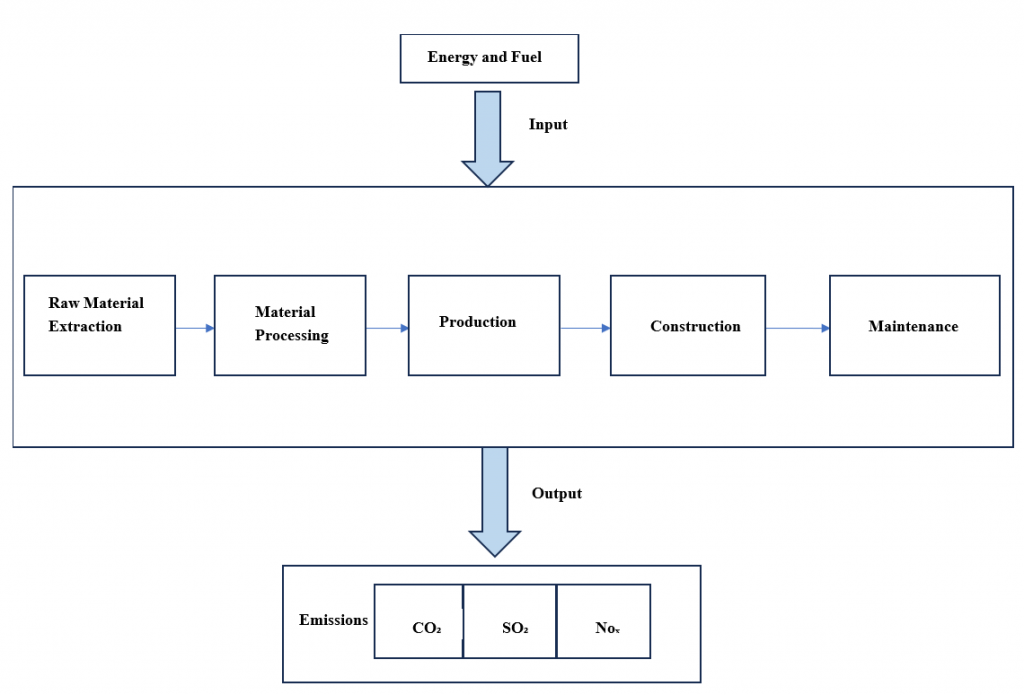
The primary goal of this study is to compare the environmental performance of different pavement alternatives within the defined system boundaries, with an emphasis on material selection and its environmental impact, and the defined system boundaries are illustrated in Figure 1. To maintain the study’s focus on the material selection strategy, the use phase (including emissions from traffic and vehicle use) is excluded from this analysis. Since many asphalt pavements undergo significant renovations when they reach the end of their design life and are rarely fully disposed of, the End-of-Life (EoL) stage is not included in this analysis.
Figure 1. System boundary for pavement LCA
3. Design Alternatives
The design alternatives are based on three typical asphalt pavement alternatives (ZHANG Hai-tao et al. 2018) used in expressway construction in Eastern China in Nanjing City. And the design is specifically on the materials selection and thickness in the course layers of the pavement system, which include the upper course (UC), middle course (MC), and bottom course (BC). The subbase, subgrade, and other substructure layers are excluded as their contribution to the environmental impact is relatively lower. The detailed structure and technical parameters of the pavement designs can be found in Figure 2.

The functional unit (FU) is defined as 1 km of asphalt pavement with a width of 7.5 meters (3.75 meters per lane in two directions). The analysis excludes the paved shoulders, both inner and outer, as well as any other features outside the primary pavement. The life spans of the pavement alternatives are based on the design traffic and are as follows: 20 years for AC-13, 23 years for SMA-13, and 25 years for AC-25.
4. Life Cycle inventory Analysis
For this analysis, I have gathered information and data about the raw materials and indicators value from Blaauw, S. A., & Maina, J. W. (2021), specifically focusing on the environmental and social indicators of bitumen. Additionally, similar data for SBS bitumen, aggregates, and mineral powders were sourced from the study “Life Cycle Inventory for Pavements: A Case Study of South Africa” by the same authors. The materials are obtained in raw form and are then processed and manufactured into their final form as required by the construction demands of the pavement.
Table 2. Life cycle inventory for pavement of different materials, performance, and environmental indicators
5. Life Cycle Timeline and Maintenance
A maintenance regime is provided for evaluation for maintenance approaches, with reference to table 2 from (Huang et al, 2021). It outlines the details of maintenance approaches as well as the frequencies and procedures.
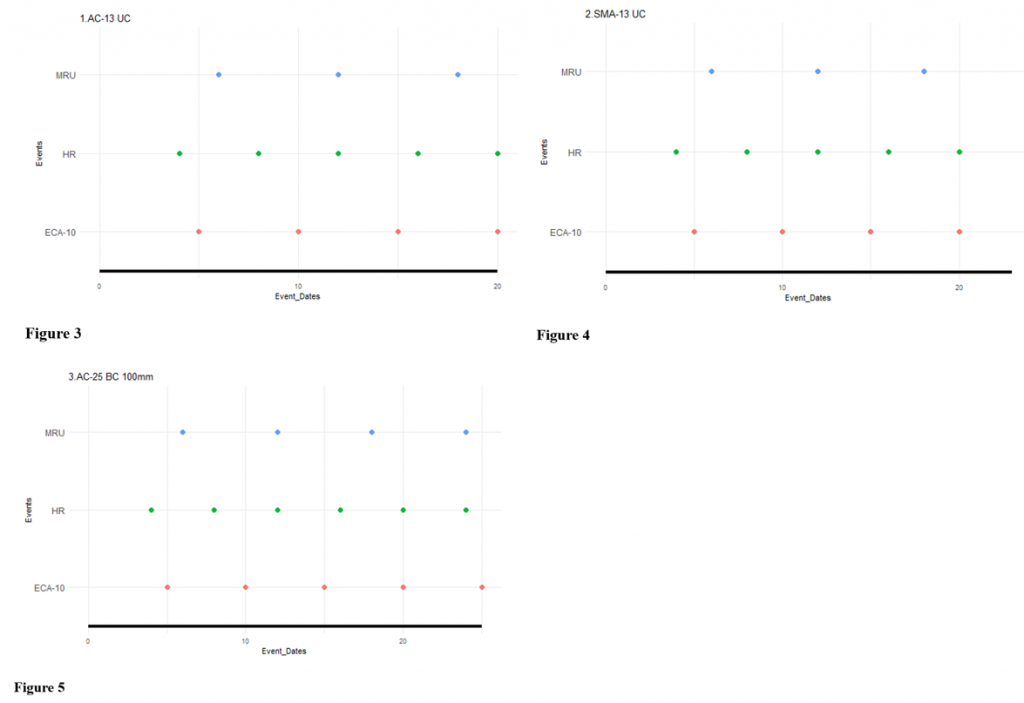
The maintenance strategies for each pavement design are detailed in Table 3, where you can find a breakdown of the maintenance events: ECA-10 (thin overlay), MRU (milling and resurfacing the upper layer), and HR (hot-in-place rehabilitation), along with their respective frequencies. The scheduling of each maintenance event can be seen in the timelines illustrated in Figures 3-5.

6. Life Cycle Analysis Results
The life cycle analysis results are summarized as in Table 4. This table presents the total energy consumption and atmospheric emissions (CO₂, NOₓ, and SO₂) for each pavement alternative over their respective life cycles within a function unit, taking into account initial construction and maintenance activities within the defined system boundaries. These results highlight the importance of material selection and maintenance in the overall life-cycle environmental impact of asphalt pavements. Pavement 1 has the lowest value level for all environmental impact indicators, while Pavement 2 has the highest, and pavement 3 represents moderate impact among the three options.
7. MCDA– Analytic hierarchy process (AHP)
With those multiple criterions for environment, I utilize the Analytic Hierarchy Process (AHP) to conduct the multi-criteria decision making. The 1–9 Saaty’s scale method was adopted, which is a commonly evaluation method in AHP for pairwise comparison of multiple factors (Wichchukit and O’Mahony, 2022). The absolute percentage difference between the values of two pavement alternatives is calculated as follows: (|Value_i – Value_j| / ((Value_i + Value_j) / 2)) * 100%. Then, based on this percentage difference, a Saaty score between 1 and 9 is assigned using the criteria shown in the table below.
For the weight coefficients of environmental impact categories of LCA, the relative importance is based on the table 3 from (Guo et al. 2023), and combined with my subjective judgement.

Figure 8. Ranking of the design options using AHP
8. Conclusion
Based on the design of three different asphalt pavements, the impact of energy consumption and gas emissions under the different design options was investigated.
- Pavement Option 1 (“AC-13 UC”) emerges as the preferred choice with the lowest overall environmental impacts across all indicators, and it is also ranked highest by the AHP. However, a primary limitation of Option 1 is its relatively shorter service life compared to the other alternatives. This shorter lifespan might impact the overall costs.
- Pavement Option 3 (“AC-25 BC 100mm”), which features a thicker bottom course layer, is a secondary consideration. While the thickened bottom layer leads to a slight increase in overall impacts compared to Option 1, it exhibits a significantly lower environmental burden than Option 2, and offers higher durability and a longer service life. This option presents a compromise between minimizing environmental impact and ensuring a longer service life. Moreover, these results indicate that modifying the thickness of the asphalt layers offers a better trade-off between environmental impact and durability than using modified asphalt.
- The notable differences in environmental impacts among the three designs highlight the importance of material selection and design decisions in influencing the overall environmental burden of road construction and maintenance.
- The simplifying assumption of modeling all maintenance as equivalent full-depth upper course reconstructions is a key limitation in this study, as is the lack of data regarding the specific impacts of different maintenance activities (such as transport and overlay). This would enable more accurate and generalizable results by using reliable, local data.
- To enhance objectivity of AHP approach, the pairwise comparisons in my assignment were derived from the percentage differences calculated through the LCA results, aiming to reduce reliance on subjective judgments. While this approach provides a systematic way to define preference, some biases may still remain. Combining both the LCA and AHP, while having their own limitations, should provide a more balanced approach for decision-making.
9. References
- Liu, Q., Cai, M., Yu, B., Qin, S., Qin, X., & Zhang, J. (2023). Life cycle assessment of greenhouse gas emissions with uncertainty analysis: A case study of asphaltic pavement in China. Journal of Cleaner Production, 411, 137263. https://doi.org/10.1016/j.jclepro.2023.137263
- ZHANG Hai-tao, MENG Liang, LÜ Li-hua. Influence of Asphalt Pavement Design Parameters on Carbon Emissions Based on LCA Technology. Journal of Highway and Transportation Research and Denelopment, 2018, 35(2): 1-7. http://html.rhhz.net/GLJTKJ/20180201.htm
- Blaauw, S. A., Maina, J. W., & Grobler, L. J. (2020). Life cycle inventory of bitumen in South Africa. Transportation Engineering, 2, 100019, pp.5. https://doi.org/10.1016/j.treng.2020.100019
- Blaauw, S. A., & Maina, J. W. (2021). Life Cycle Inventory for Pavements—A Case Study of South Africa. Transportation Engineering, 3, pp.14. https://doi.org/10.1016/j.treng.2021.100049
- Santos, J., Bryce, J., Flintsch, G., Ferreira, A., & Diefenderfer, B. (2015). A life cycle assessment of in-place recycling and conventional pavement construction and maintenance practices. Structure and Infrastructure Engineering, 11(9), 1199–1217. https://doi.org/10.1080/15732479.2014.945095
- Huang, M., Dong, Q., Ni, F., & Wang, L. (2021). LCA and LCCA based multi-objective optimization of pavement maintenance. Journal of Cleaner Production, 283, 124583. Table 2 https://doi.org/10.1016/j.jclepro.2020.124583
- Guo, X., Li, Y., Shi, H., She, A., Guo, Y., Su, Q., Ren, B., Liu, Z., & Tao, C. (2023). Carbon reduction in cement industry—An indigenized questionnaire on environmental impacts and key parameters of life cycle assessment (LCA) in China. Journal of Cleaner Production, 426, 139022. https://doi.org/10.1016/j.jclepro.2023.139022
- Wichchukit, S., & O’Mahony, M. (2022). The 9-point hedonic and unstructured line hedonic scales: An alternative analysis with more relevant effect sizes for preference. Food Quality and Preference, 99, 104575. https://doi.org/10.1016/j.foodqual.2022.104575
| Main Page | Introduction | Integration Context of the Civil Systems | Maintenance Strategies | Life Cycle Analysis | Multi-Objective Optimization |


