Studying each system’s(1) lifetime, (2) defined interventions in the form of maintenance or replacement, and (3) frequency, is one of the first stages to optimizing the interfaces of the four separate systems. By designing various interfaces between the four separate systems, the primary objective is to investigate how each system affects the others and, consequently, how the failure of one system can cause the other systems to malfunction. This brings us to the primary objective of the multi-objective optimization, which is to shorten any maintenance period and lengthen the interval between subsequent maintenance operations.
MAINTENANCE STRATEGY FOR INDIVIDUAL SYSTEM:
The timeline model was initially established as a function that took into account a function’s lifetime, any recurring maintenance events, and the frequency and duration of those events. One list contained every occurrence. Since each system has a unique lifetime based on technical and environmental factors, choosing a common lifetime was challenging. For all systems, a lifetime of 120 years was set.
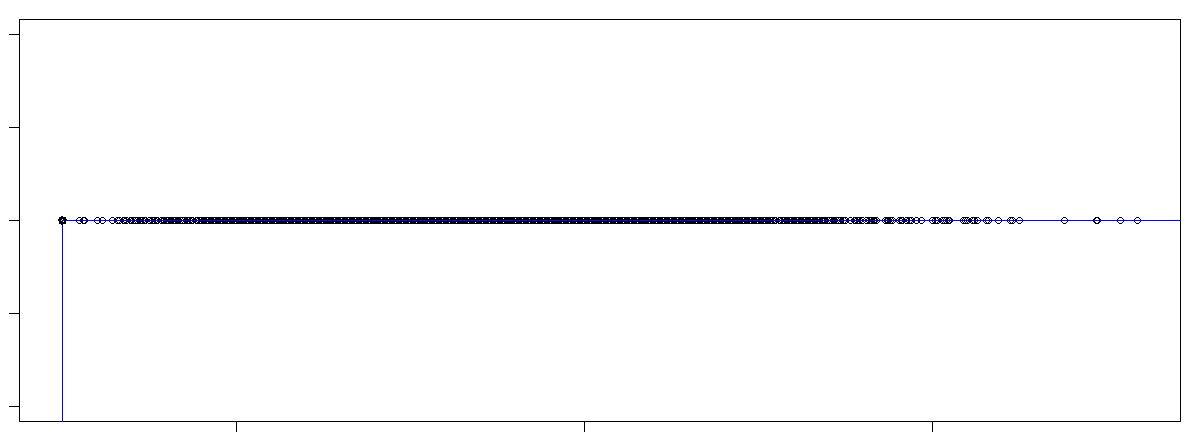
The following figures show the maintenance plans for the sub-systems visualized as time-line plots.
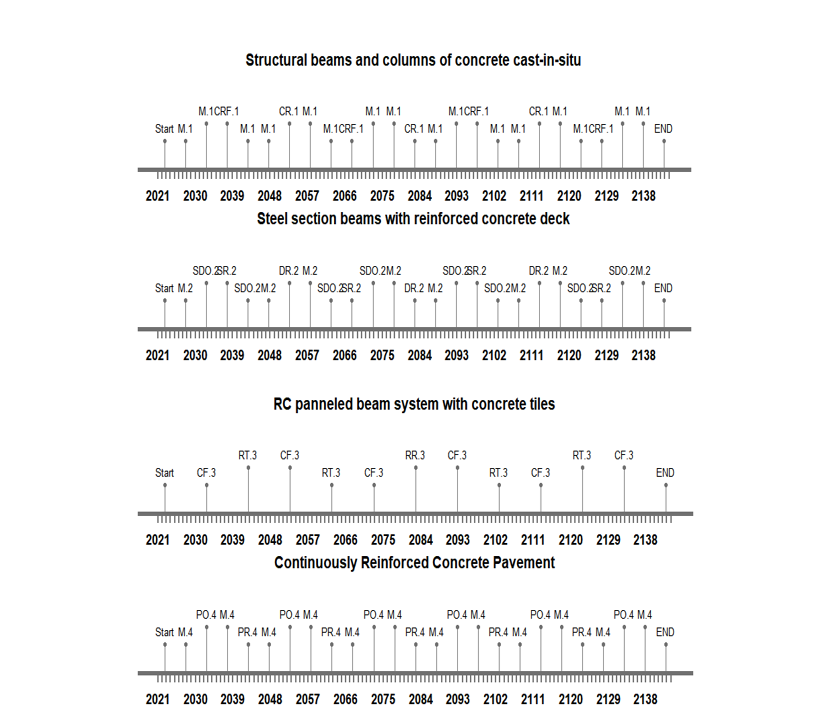
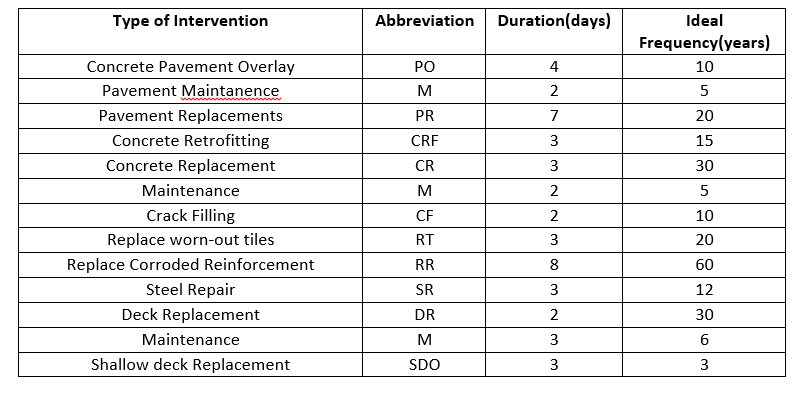
The table represents all the information of the Interventions that were chosen for the to plot the timeline of the maintenance strategy of each system:
MAINTENANCE STRATERGY FOR THE INTEGRATED SYSTEM:
All four lifetimes were combined, and a total number of interventions lasting 104 days over the predetermined lifetime of 120 years was calculated. This indicates that the separate systems’ maintenance approaches are generally distinct from one another.

Through the successful simulation of all conceivable system outlines with an output of the entire interruption duration, more potential scenarios were put into action. These were implemented using a fixed grid of two, which implies that two values were taken from each frequency range that was specified for each system individually. The list that follows shows potential outcomes for each unique system.
A minimum intervention time and a maximum interval between interventions are clearly preferred by the simulation results.
Our systems initially required a total of 104 days of maintenance over the course of their lifetime, which is longer than 3 months. Therefore, it is necessary to enhance this value in order to better schedule the maintenance (in the best circumstances, they will overlap), which will cut down on the number of days interventions.
The frequencies and durations in our scenario space, or the collection of data obtained from each of our unique systems are used in a Pareto efficiency. By doing this, the ideal schedule for planned interventions can be found. First, a combination is created based on the therapies’ “lowest intervention durations and high time gaps.” The outcomes produced by this design are shown below.
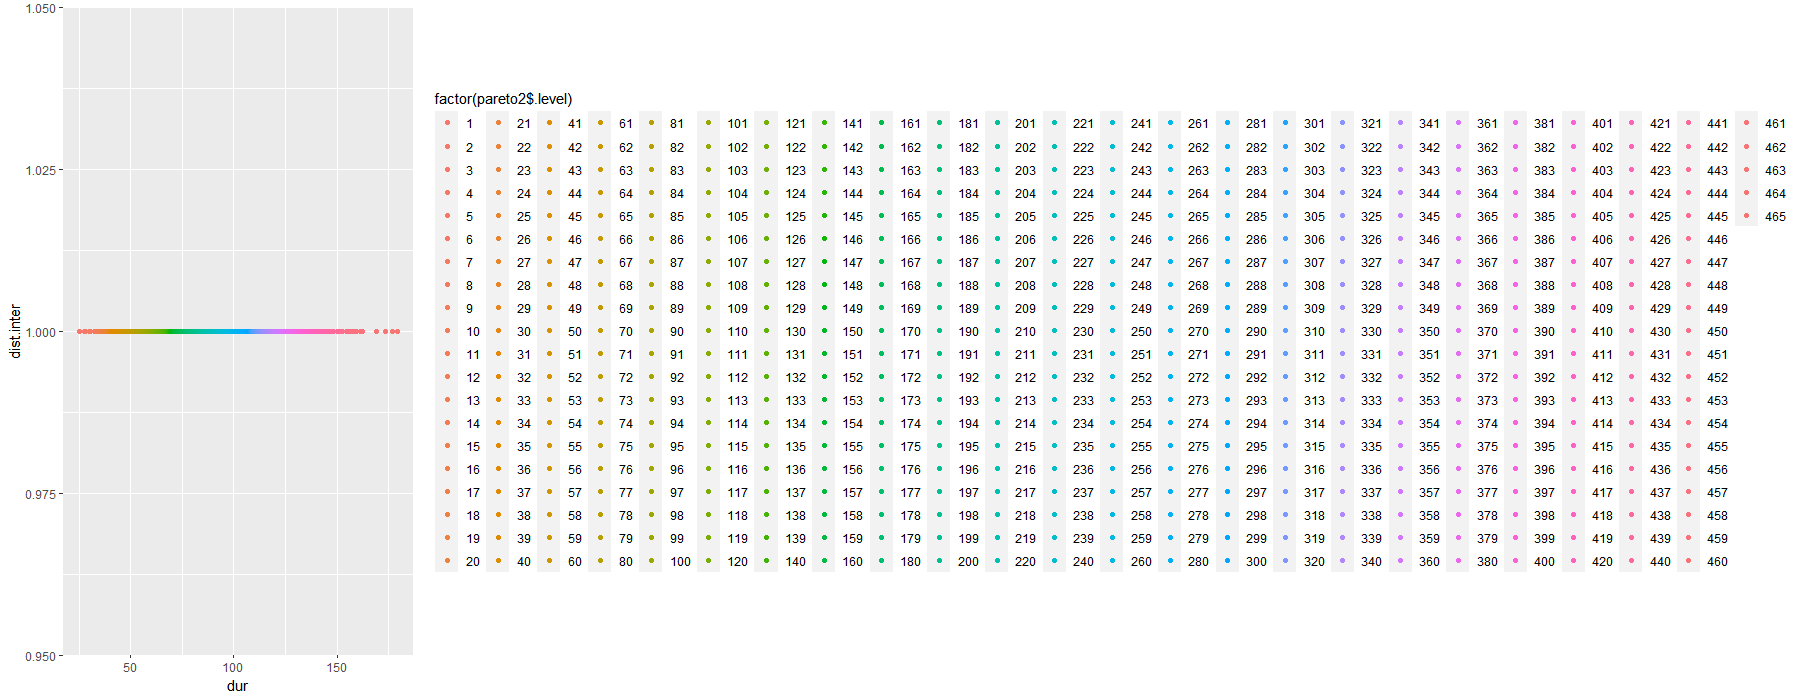
The visual colour index can already be used to assess the outcomes: The best options are represented by the hue orange (Colour with the best alternative), while the pink is less appropriate.
But it is impossible to see the diagram clearly. We may observe the optimal values for the combination of short intervention times while maximizing the intervals between these intervention events by running the Pareto frontier. Below is the plot derived by running the simulation for Pareto frontier.
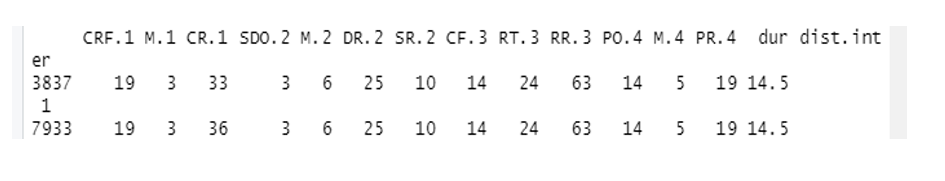
The Pareto frontier display that maintenance days revolve at around 14.5 days for the best solution, which is far better then the one we got in the first place, that is 104 days. The table below shows the numerical values for the interventions in the two most suitable solutions described above.