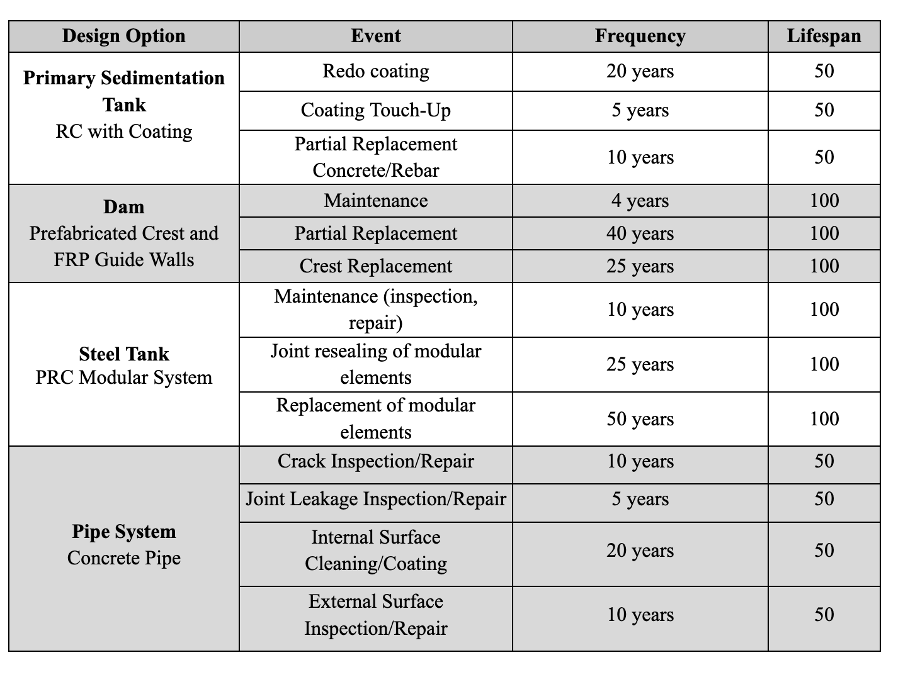
 WITH INTEGRATION CONTEXT – BEFORE OPTIMIZATION
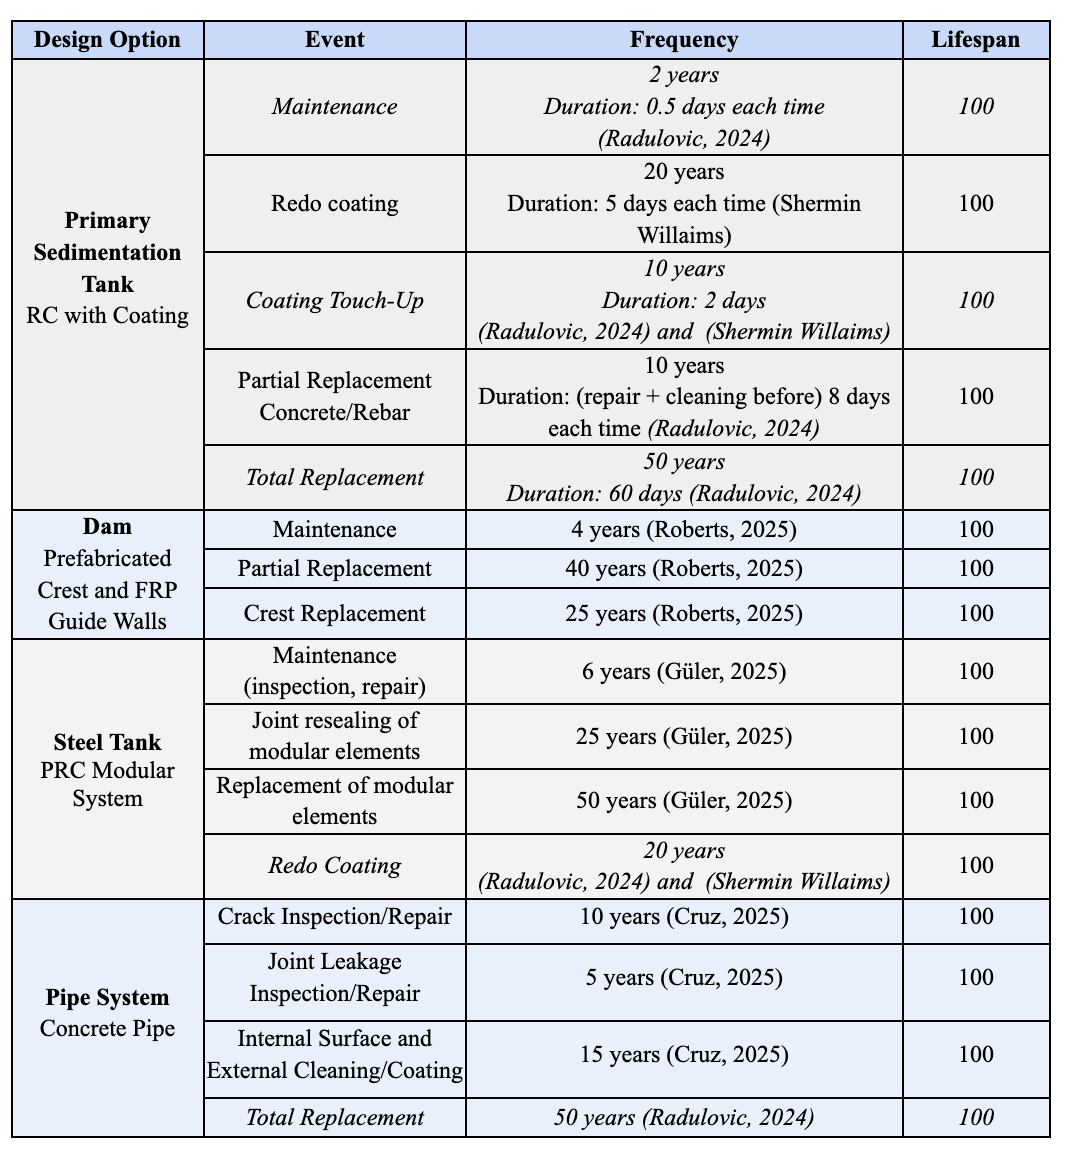 The original, non-integrated maintenance schedule is shown on the left (Fig 1). Changes were made to include the integration context on the right (Fig 2). In addition to the integration of maintenance schedules, the duration for each maintenance event was also added based on data sheets from the chosen material (ex: coating material) or from personal experience. Personal experience is noted as: (Roberts, 2025), (Güler, 2025), (Radulovic, 2025), or (Cruz, 2025)
Lifetime: Integrating the different systems required making lifespan changes. While the Dam and Steel Water Tank had lifetimes of 100 years, the Primary Sedimentation Tank and Pipes had a lifetime of 50 years. To integrate these systems together, it was assumed that the Primary Sedimentation Tank and Pipes would be completely reconstructed every 50 years.
Primary Sedimentation Tank
- Maintenance (Added): Maintenance was added to the primary sedimentation tank as a general intervention category to include any small repairs not related to coating touch ups or partial replacement of the reinforced concrete. This was done to improve the accuracy of Project 2. This was purposefully made into a general category because including all small repairs would take significantly more computing power to later find the pareto optimal set. The duration of these repairs is assumed to be 12 hours (Radulovic, 2025).
- Coating Touch-Up (Edited): The frequency was changed to 10 years, as recommended by the material manufacturer (Sherwin Williams).
- Total Replacement (Added): As explained in the Lifetime Section, since the lifetime of the Primary Sedimentation Tank is 50 years, it is assumed that it will be rebuilt every 50 years.
Dam
- Maintenance (Edited): Maintenance was increased to every 2 years due to integration context. Since the dam is now close to a town, it is of utmost importance that the service level of the dam be extremely high. If the dam broke, the town would be flooded, and the death toll would likely be high. Thus, the frequency of all interventions was increased. In Germany, dams are always considered to be designed and maintained with special care due to the gravity of potential disaster (Hinkelmann, 2024).
Steel Water Tank
- Redo Coating (Added): This intervention added since the steel tank has coating. It is assumed in the integration context that coding for the steel water tank and primary sedimentation wastewater tank will have the same initial frequency and range. While wastewater is more corrosive, steel is more prone to corrosion so more opposing effects are assumed to cancel out, resulting in the same coating frequency.
Pipes
- Internal/External Surface: These two maintenance events were combined because it makes sense that will occur at the same time. Combining them into one event means less downtime for the customers.
Timelines:
The timelines of the maintenance schedules are seen above (before varying them in multiobjective optimization).


 Service Level: The service level of all systems was considered when choosing the maintenance range.We did not choose to increase the frequency too much and compromise the service level because water infrastructure is one of the most essential core infrastructure systems. However, increased maintenance to maintain a high service level also has a bad side: higher system downtime. This is extremely frustrating for customers when there is no running water. In order to fix this problem of having no running water during system downtime, we changed the context of our system integration. Berlin water, wastewater tanks, and pipes are usually designed with double the normal flow (cite lecture). Instead of designing 1 steel water tank, 1 wastewater tank, and 1 pipe system each able to handle double the normal flow, we designed: 2 steel tanks, 2 wastewater tanks, and 2 pipe systems capable of the normal flow. Maintenance of these 2 systems would be shifted by 6 months so that they are not out of commission at the same time.
This separation was done not just thinking about service level to the general population, but also in terms of accessibility and diversity. Situations like recovering from surgery or childbirth while having no running water is significantly worse than just for the general population.
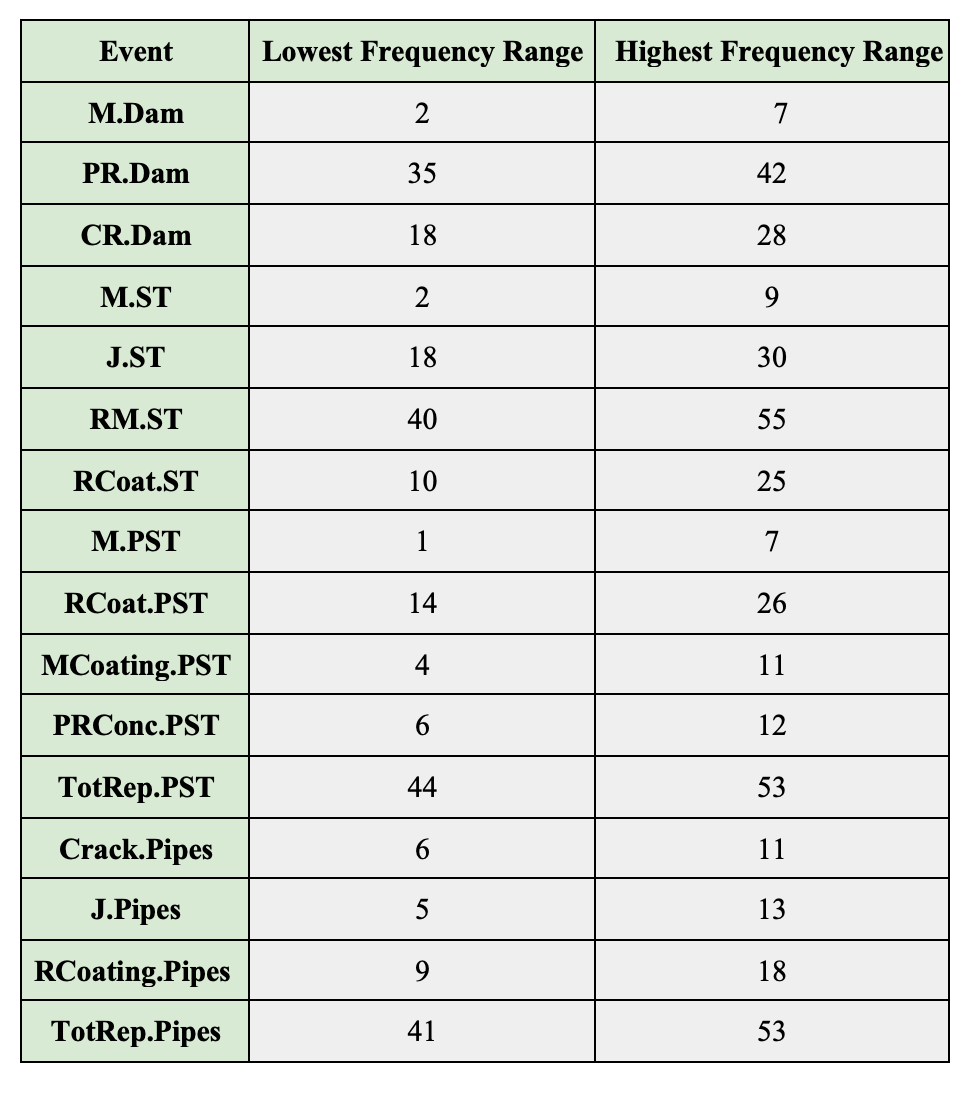
Range of Maintenance Events: Maintenance event ranges were between ± 3 to 10 years added to main starting value. The range for each maintenance event frequency was shifted to the left of the base frequency because service level will be higher if maintenance is done more often, and downtime is not as important to us as service level since we have all versions of most parts of the system.
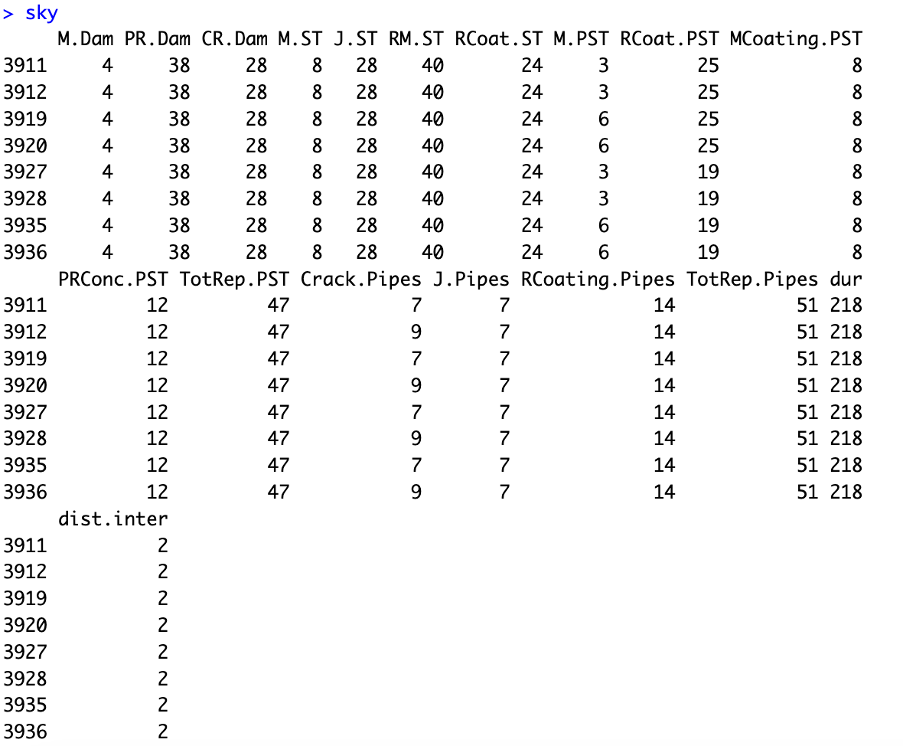
 Pareto Front Regarding Total Duration of Interventions and Frequency of Interventions:Running this experiment with n.grid <- 2, we find solutions for maximizing the interval between maintenance events and minimizing the total duration that the system will be affected. Reflecting, if we were able to run the code with n.grid <- 3, 4, or 5, we would find better solutions, but the code would not run with an n.grid greater than 2 due to the large number of intervention parameters. Running “sky” we are able to find 8 maintenance solutions which optimize maximizing the interval between maintenance events and minimizing the total duration that the system will be affected. At this point in the study, we recommend using this schedule. However, later in the study, we will do a more in depth recommendation taking into account the Pareto Front with duration, intervention frequency, cost, and emissions.
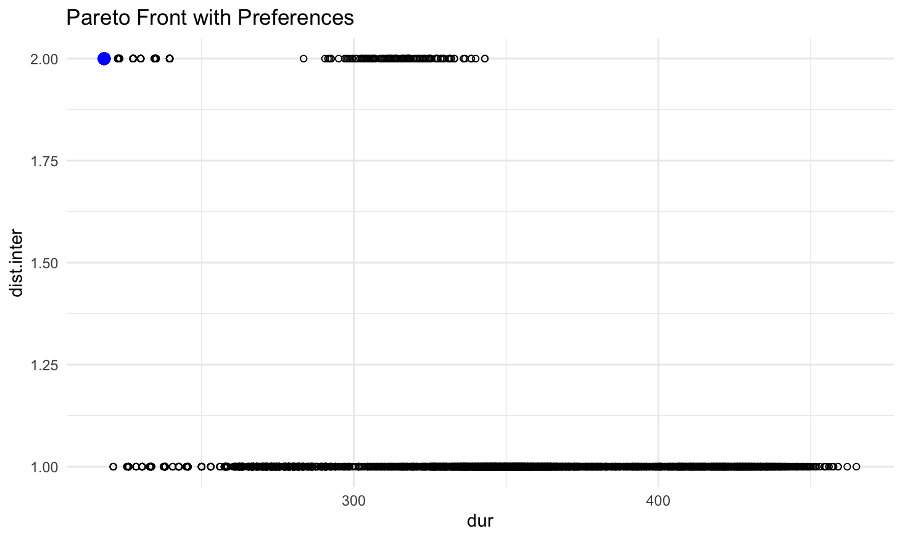

Total Duration of All Interventions: The total duration of all interventions with this basic maintenance schedule was 327 days. By doing Multi Objective Optimization using the Pareto Front, we will decrease this significantly later in the report.
