1-Introduction:
In contemporary times, decisions made through the life cycle assessment of a system can exert a significant impact on the environment, particularly in the context of substantial projects like multi-story buildings. Based on the previous assignment, the focus of my system is a multi-story building, with the chosen subsystem being RC columns—integral structural components in buildings of this nature.
2. Goal and scope of the assessment
This project involves conducting a life cycle assessment specifically focused on the RC columns of the building. The assessment incorporates three different types of concrete mixtures. The primary objective is to comprehensively analyze the energy consumption and greenhouse gas emissions associated with utilizing various concrete mixes in our RC columns. The scope and boundaries of this assessment are visually represented in the figure below.
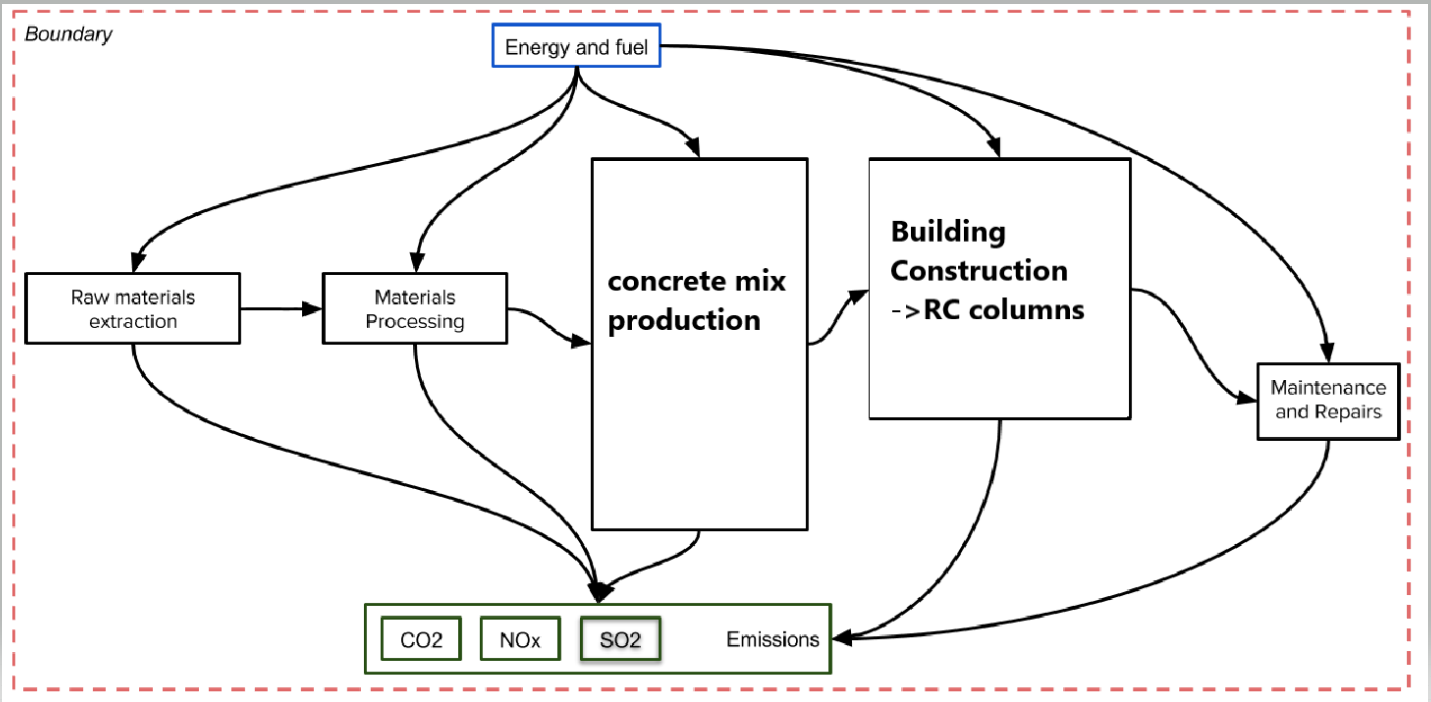
Figure 1 Boundary of the system
This scope is defined to guide design engineers in determining the energy and emission factors for each types of concrete used in the construction of the RC columns.
The reason why I chose RC columns with different concrete strengths to assess their environmental impact is rooted in my research on the significance of materials in the concrete mix concerning environmental consequences. An important article[1] I encountered conducted a life cycle assessment of three distinct RC columns, each utilizing concrete with varying strengths (30, 40, 60). The analysis aimed to determine whether the increase in concrete strength could affect emissions released into the atmosphere, particularly CO2.
The findings from this article were compelling and serve to provide the objective of my assignment. The direct effects of higher concrete strength enabled a 15% reduction in concrete consumption. Additionally, there was a substantial decrease due to the indirect effects of higher concrete strengths, resulting in a reduction in steel consumption by up to 22%.
Concerning the compressive strength of concrete, it was observed that a 5 MPa increase led to an average durability improvement of 38%. Furthermore, the study concluded that the performance of a concrete structure, in relation to its service life, is markedly influenced by covering and concrete strength. The types of cement studied did not induce significant variations in the results. The findings strongly advocate for the adoption of higher strength concretes in columns to mitigate environmental impacts and material consumption.
Consequently, I decided to incorporate the same approach in assessing my own life cycle analysis, aligning with the interesting findings of the aforementioned article. The influence of the diameter of steel bars is not considered in my analysis, and for simplicity, I maintained an axial load of 130 k and an axial live load of 180 k following ACI 318 for all the columns. However, three different design options exist for this analysis.
3. Design options
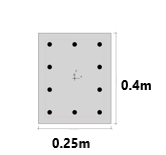
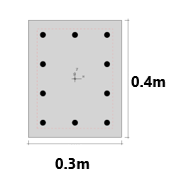
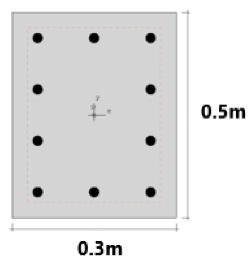
Option 1(C35) Option 2 (C25) Option 3 (C20)
Fig. 2 shows the different design options used for the analysis and Table 1 describes the three different design options.
| Design option | Structural material | Description |
| option1 | Cast in concrete 1 | concrete with compressive strength of 35mpa |
| Option2 | Cast in concrete 2 | concrete with compressive strength of 25mpa |
| Option3 | Cast in concrete 3 | concrete with compressive strength of 20mpa |
Table 1 –Design Options
| Element | Cross section area (m2) | Material |
| Column1 (C35) | 0.25*0.4 =0.1m2 | 35 MPA ,Concrete ready mix 1 [1] |
| Column 2(C25) | 0.3*0.4=0.12m2 | 25MPA ,Concrete ready mix 2 |
| Column3 (C20) | 0.3*0.5=0.15m2 | Concrete3,Concrete ready mix 3 |
Table 2- Cross-Section Areas of Different Options
While I acknowledge that my column designs may not be entirely realistic, the earlier referenced article has enlightened me on the fact that increasing concrete strength can indeed lead to a reduction in the cross-section of structural members, as well as a decrease in the volume of concrete and the consumption of steel in reinforced concrete buildings. By elevating the compressive strength of RC columns from grade C30 to grade C60, the consumption of concrete and reinforcing steel can be reduced by 5.4% and 38.6%, respectively. Therefore, my assumption is grounded in this understanding, and the dimensions of the columns are chosen in accordance with ACI 318, utilizing steel with a strength of 415 MPa.
4.Life-Cycle Inventory
Table 3 represents the composition for different materials used in this project. The table shows the information regarding the energy consumption, CO2, NOX and SO2.
| material | scope | quantities | energy | CO2 | NOX | SO2 |
| Cement | C35 | 335 | 3.26 | 0.822 | 0.177 | 0.065 |
| Coarse Aggregates | C35 | 1187 | 0.0035 | 0.016 | 0.0018 | 0.0018 |
| Fine Aggregates | C35 | 712 | 0.0023 | 0.0053 | 0.009 | 0.009 |
| Reinforcement | C35 | 96 | 2430 | 225 | 0.71 | 1.85 |
| Cement | C25 | 279 | 3.26 | 0.822 | 0.177 | 0.065 |
| Coarse Aggregates | C25 | 1187 | 0.0035 | 0.016 | 0.0018 | 0.0018 |
| Fine Aggregates | C25 | 771 | 0.0023 | 0.0053 | 0.009 | 0.009 |
| Reinforcement | C25 | 113 | 2430 | 225 | 0.71 | 1.85 |
| cement | C20 | 223 | 3.26 | 0.822 | 0.177 | 0.065 |
| Coarse Aggregates | C20 | 1127 | 0.0035 | 0.016 | 0.0018 | 0.0018 |
| Fine Aggregates | C20 | 831 | 0.0023 | 0.0053 | 0.009 | 0.009 |
| Reinforcement | C20 | 119 | 2430 | 225 | 0.71 | 1.85 |
Table 3-Material Composition
Here, C35, C25, and C20 represent three different concrete mixes with varying concrete strength. The energy values for each material are expressed in MJ/t. The quantities listed for all materials denote the amounts required for 1 m3 of concrete, while the quantity for reinforcement is measured in kilograms. I selected the quantities for reinforcements based on a first reference, and to support this, I have included a picture related to this information. I utilized the provided data and employed a straightforward, directly proportional relationship to validate the quantities needed for my specific case.
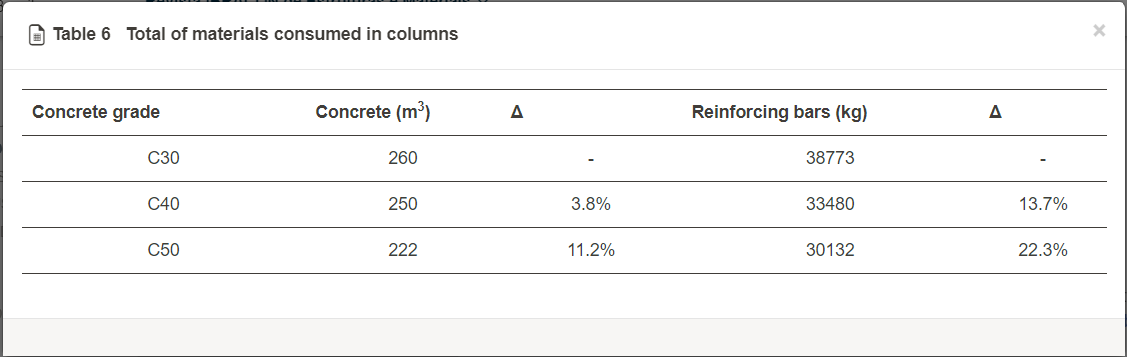
Figure 3 Reinforcement quantity from the first reference for different concrete strength
5. Life-Cycle Timeline
For the construction of the timeline we will use the following maintenance interventions as given below:
| DesignOption | Event | Frequency | Total Lifespan |
| C35 | Concrete Repair | 20 | 100 |
| C35 | Maintenance | 1 | 100 |
| C35 | Concrete Replacement | 46 | 100 |
| C25 | Concrete Repair | 14 | 100 |
| C25 | Maintenance | 2 | 100 |
| C25 | Concrete Replacement | 33 | 100 |
| C20 | Concrete Repair | 11 | 100 |
| C20 | Maintenance | 3 | 100 |
| C20 | Concrete Replacement | 26 | 100 |
Table 4-Interventions and life span of different designs
| Event | Description |
| Concrete Repair | Repairing cracks, spalling, or other damage to the concrete surface |
| Maintenance | Periodic inspections and cleaning to maintain the column in good condition |
| Concrete Replacement | Replacing damaged or deteriorated concrete |
Table 5-Description of Events
Extending the service life of structures is an important strategy to mitigate the environmental impacts, in particular, the global warming potential, of the building sector. As a key factor determining service life, the durability performance of reinforced concrete has been investigated for decades.[1] To create this table, I couldn’t locate precise information on the frequency of interventions. Therefore, I made assumptions based on the general trend observed in an article [2]. The pattern indicated that increasing the strength of concrete reduces the frequency of interventions needed. I then assumed a directly proportional relationship. Although the article features different concrete layers, which is not my main focus, the depicted trend with varying concrete covers provides valuable insights.
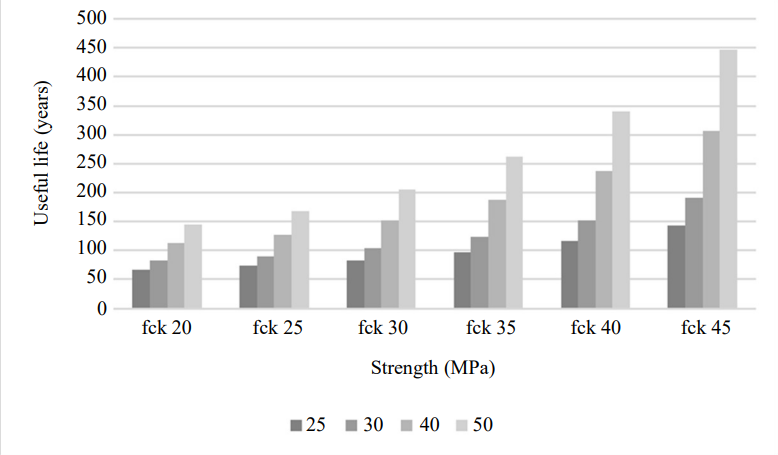
Figure 4 Useful life of RC columns with different concrete strengths (this figure is from the study referenced)
Here is the timeline from the article I selected to observe the trend. However, please note that in this timeline, “fck” represents the concrete cover, while the three bar charts illustrate the strength of concrete. As we move from the darker gray color (indicating the lowest strength) to the lighter gray (representing the highest strength), it becomes apparent that the useful service life increases.
The generated timeline for the Options are shown below:
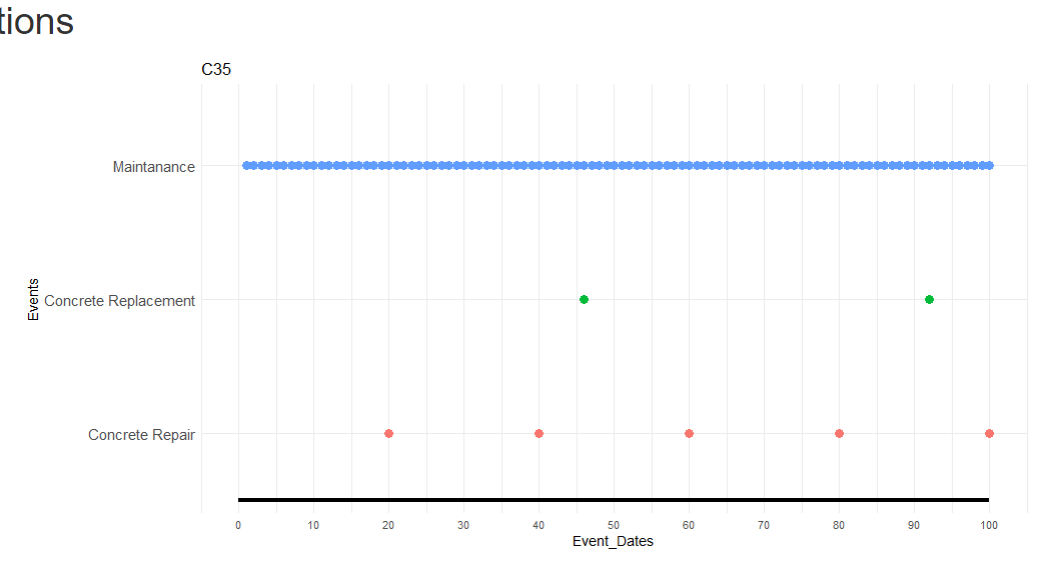
1.column1 with concrete strength of 35 MPa
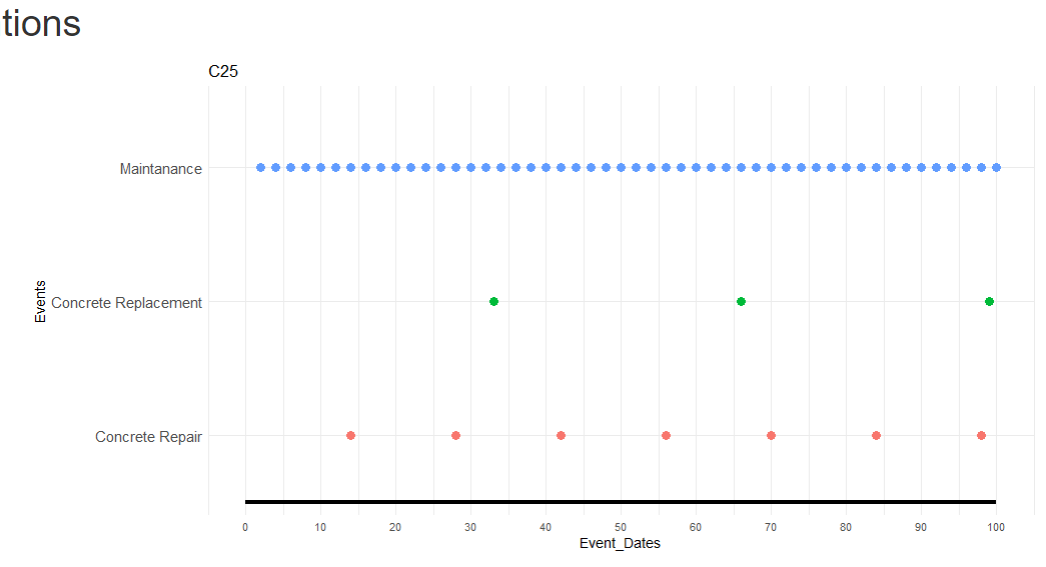
2.column2 with concrete strength of 25 MPa
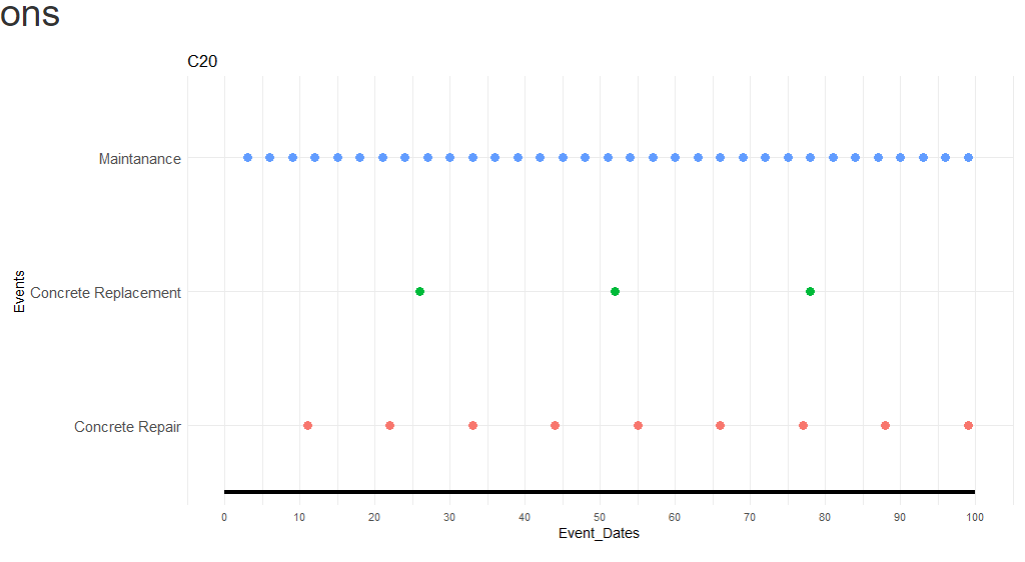
3.column3 with concrete strength of 20 MPa
6. Life Cycle Inventory Analysis
The Life Cycle Inventory Analysis for the three Options is done and the corresponding results are obtained and presented in the figures below.
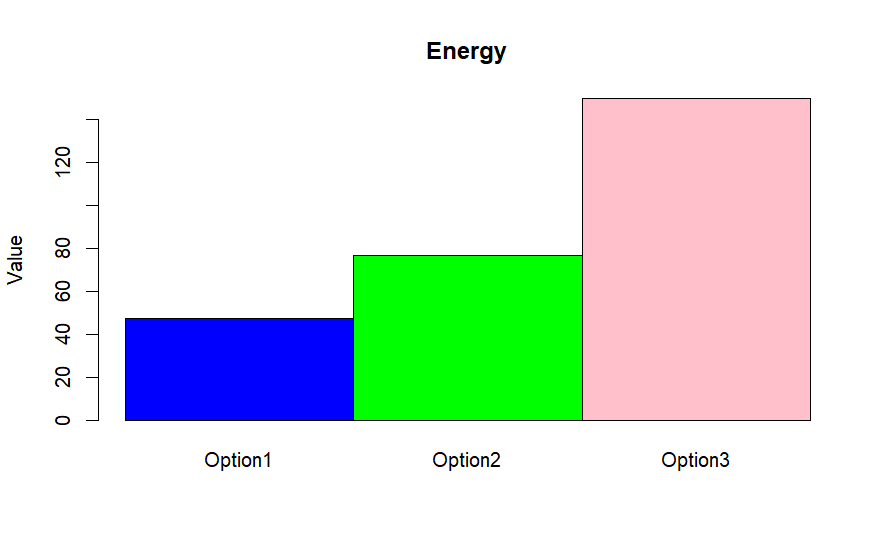


Figure 5 Energy Consumption and Emissions for Different Design Options
From these bar charts, it is evident that Option 1 has the lowest levels of energy consumption, CO2, NOx, and SO2. This aligns with our expectations, as decreasing concrete strength (Option 1 having the highest strength and Option 3 having the least strength) typically leads to increased volume of concrete and weight of reinforcement. This increase in materials can contribute to higher energy consumption and the release of more gases, as discussed in the earlier information.
7. Analytic hierarchy process (AHP)
In our case, the objective is to rank design options using criteria such as energy consumption, CO2 emissions, NOx emissions, and SO2 emissions. The considered alternatives are the design options labeled “Option1,” “Option2,” and “Option3.” In this step, I defined four matrices in R based on the precise values obtained from the bar charts presented above.
Following this step, the most crucial aspect involves the pairwise comparison between our criteria (energy, CO2, NOx, and SO2) using Saaty’s 1-9 scale. To facilitate this comparison, it was essential to assign weights to each criterion. The analysis can vary from case to case, as each study has its own unique goals and scope. For instance, in my case, I assigned the following weights to each criterion: energy (20%), CO2 (45%), NOx (20%), and SO2 (15%).
These weights were determined based on the goal of my study, which I mentioned earlier: a significant emphasis on reducing CO2 emissions. Thus, CO2 was assigned a higher weight of 45%, while energy consumption and NOx emissions were considered equally important(20%) due to some slight limitations on these two criteria in my country. The lowest weight in my case was assigned to SO2(15%). After establishing these weights, to conduct the pairwise comparison, I created a 4×4 matrix for these criteria and assigned numerical values based on my weights, considering Saaty’s 1-9 scale.
In this matrix, we see that CO2 is way more important than energy consumption, so I gave it a value of 1/7. Then, NOx and energy consumption are equally important, so I gave them a value of 1. Also, SO2 is somewhat less important than energy consumption, so I gave it a value of 3. I followed the same approach for all the rows and columns. And remember, the matrix needs to follow the reciprocal condition, as shown in the figure above.
After conducting the analysis and running the matrix in R, the resulting ranking is shown in Figure 6:
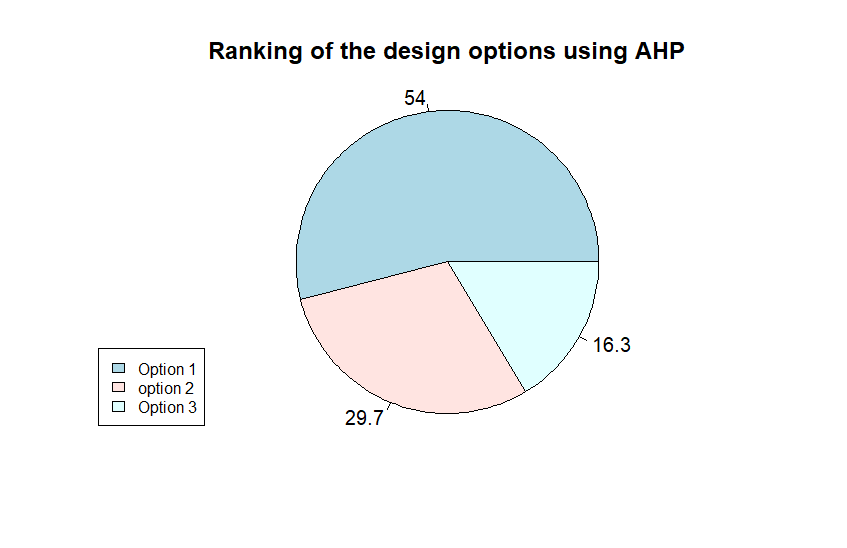
Figure 6 Ranking of Design Options(AHP)
As evident from the results, the findings strongly support Option 1 (the RC column with the highest concrete strength of 35MPa) with 54%, followed by Option 2 with 29.7%, and Option 3 (the RC column with the least concrete strength of 20MPa) with 16.3%.
8. Conclusion
Upon completing this study and comparing the outcomes of the life cycle inventory analysis and AHP, it becomes apparent that the results are inherently subjective. For instance, in my case, CO2 emerged as significantly important, but in another project, the emphasis might shift to energy consumption, altering the decision matrix and, consequently, the preferred option. Therefore, the AHP results are notably dependent on the specific goals and constraints of individual projects, highlighting the need for a tailored approach to decision-making in life cycle assessments.
9. References
1-Bacelar, Bruno Athaíde, Thalita Cardoso Dias, and Péter Ludvig. “Reduction of the Environmental Impacts of Reinforced Concrete Columns by Increasing the Compressive Strength: A Life Cycle Approach.” Revista IBRACON de Estruturas e Materiais 15 (November 11, 2022): e15610. https://doi.org/10.1590/S1983-41952022000600010.
2-Li, Chen, Jiaqi Li, Qiang Ren, Qiaomu Zheng, and Zhengwu Jiang. “Durability of Concrete Coupled with Life Cycle Assessment: Review and Perspective.” Cement and Concrete Composites 139 (May 1, 2023): 105041. https://doi.org/10.1016/j.cemconcomp.2023.105041.
3-Marceau, Medgar L, Michael A Nisbet, and Martha G VanGeem. “Life Cycle Inventory of Portland Cement Concrete,” n.d.
4-Mezzomo, Tamires, and Moacir Kripka. “Parametric Study to Maximize the Useful Life of Reinforced Concrete Columns.” International Journal of Structural Glass and Advanced Materials Research 5 (June 8, 2021): 226. https://doi.org/10.3844/sgamrsp.2021.226.233.