To account for the different lifetimes of the sub-systems the dominant lifetime of the ETICS with 60 years was chosen. In the analysis the individual systems were adapted to that lifetime by including interventions to extend their lifetime to 60 years.
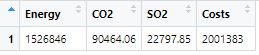
The combined assessment of the life-cycle emissions of the integrated civil engineering system gives the following total energy, emissions and cost results.
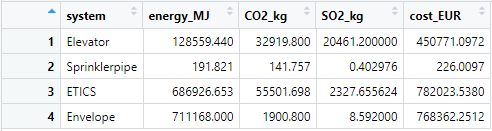
The results can be presented and visualized according to the individual sub-systems.
Since the cost is the aspect newly introduced in this project, it is presented in the following broken down by sub-system.
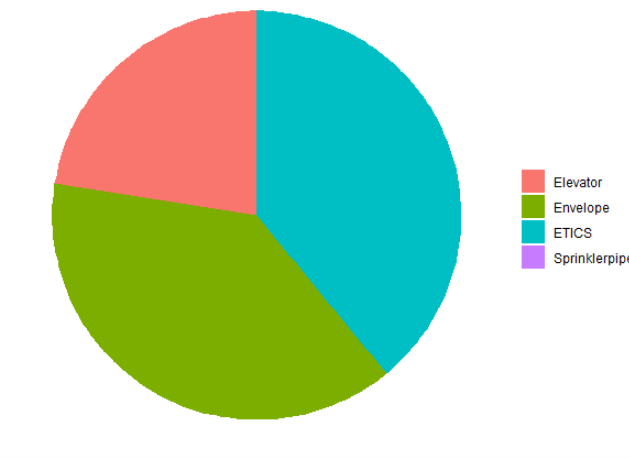
From the detailed results and the visualizations, the sub-systems dominating each emission criterion can be identified. In overall, the sprinklerpipe has a relatively low influence on all criteria. The ETICS show the highest CO2 emissions and highest cost. The elevator dominates the SO2 emissions. The energy consumption is the highest for the envelope.
Navigation