The purpose of maintenance strategies in Life Cycle Assessment (LCA) for integrated systems is to evaluate the environmental impacts of different maintenance options and to determine the optimal maintenance strategy that minimizes the overall environmental impact over the life cycle of the system. Maintenance activities can have significant environmental impacts, such as increased energy consumption, emissions, and waste generation. Thus, considering maintenance strategies in LCA is important to ensure a comprehensive assessment of the environmental performance of the system.
Our project consists of three different systems: bridge, railway tracks and water pipes. To maintain the integrated system, the maintenance measures have been computed. The following tables show the lifespan of each system and their design option with their corresponding maintenance measures that were used for the computation of the timelines.
| System | Design option | Lifetime [years] |
| Bridge | Cast in place deck and concrete girders | 60 |
| Railway tracks | Concrete Sleeper | 50 |
| Water pipes | Concrete Pipes | 8 |
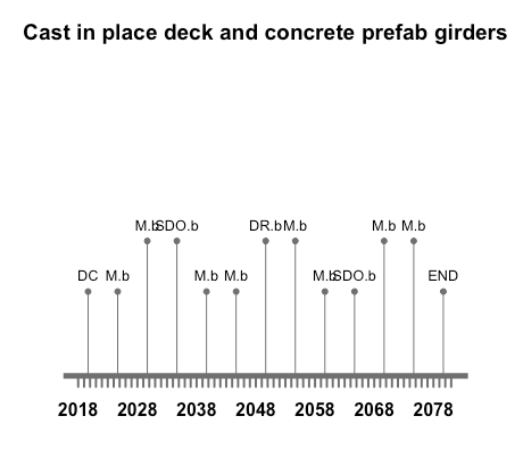
Bridge maintenance measures
| Measure | Abbreviation | Frequency [years] | Lower bound [years] | Upper bound[years] | Duration [days] |
| Shallow deck overly | SDO.b | 15 | 10 | 20 | 7 |
| Maintenance | M.b | 5 | 2 | 7 | 2 |
| Deck replaceent | DR.b | 30 | 27 | 33 | 21 |
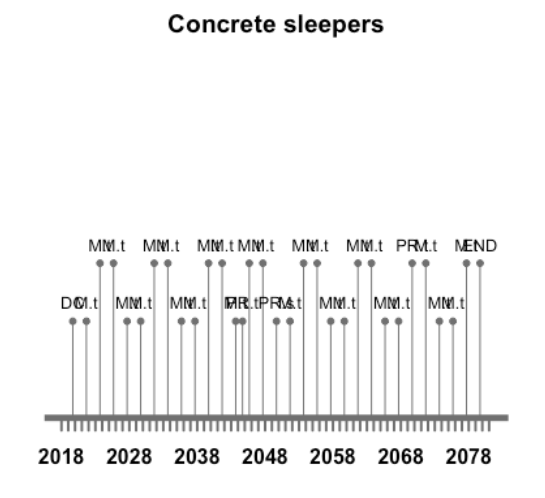
Railway Track maintenance measures
| Measure | Abbreviation | Frequency [years] | Lower bound [years] | Upper bound[years] | Duration [days] |
| Maintenance | M.t | 4 | 2 | 4 | 3 |
| Tightening | T.t | 10 | 8 | 12 | 2 |
| Permanent replacement | PR.t | 50 | 40 | 60 | 25 |
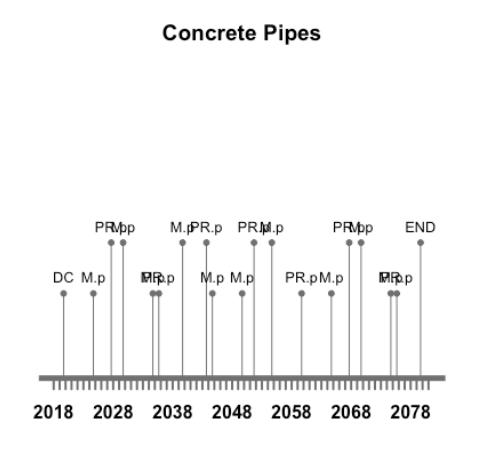
Pipes maintenance measures
| Measure | Abbreviation | Frequency [years] | Lower bound [years] | Upper bound[years] | Duration [days] |
| Maintenance | M.p | 5 | 4 | 6 | 2 |
| Permanent replacement | PR.p | 8 | 5 | 9 | 5 |
| Inspection | I.p | 2 | 1 | 3 | 1 |
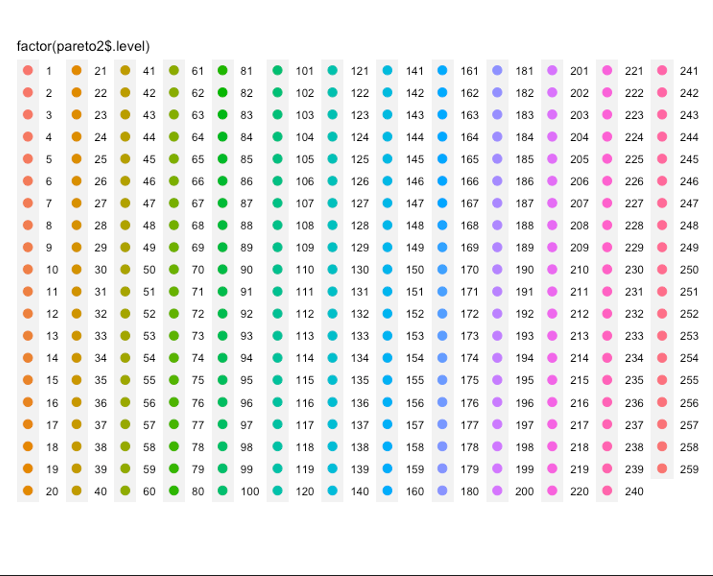
A simple combination of each individual timeline, see graphs below, gives a downtime of 160 days over the set lifespan of 60 years.
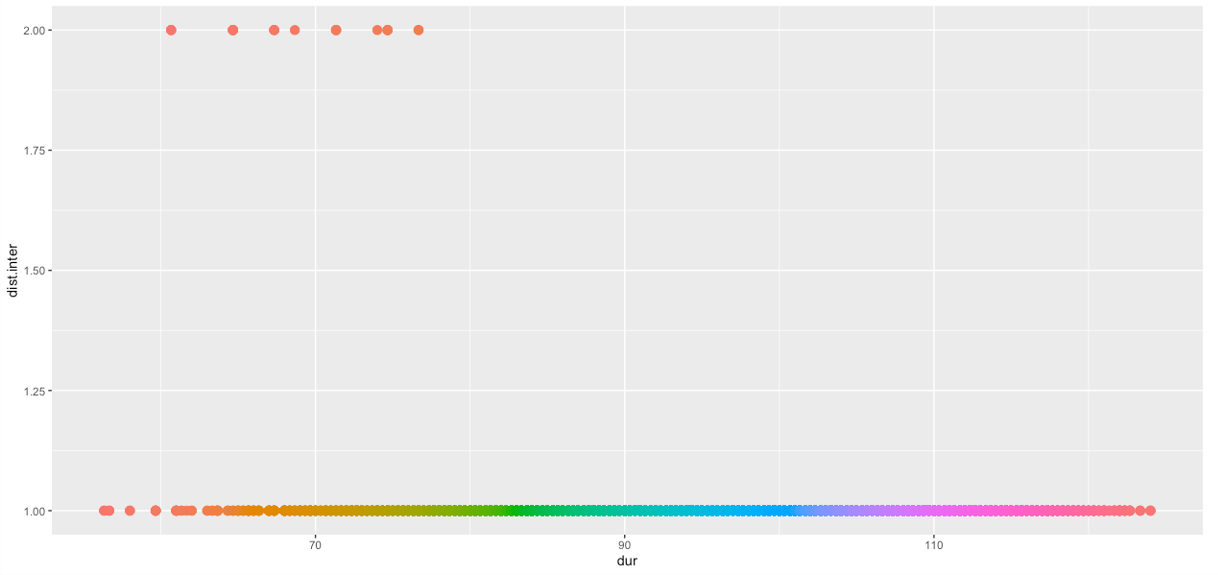
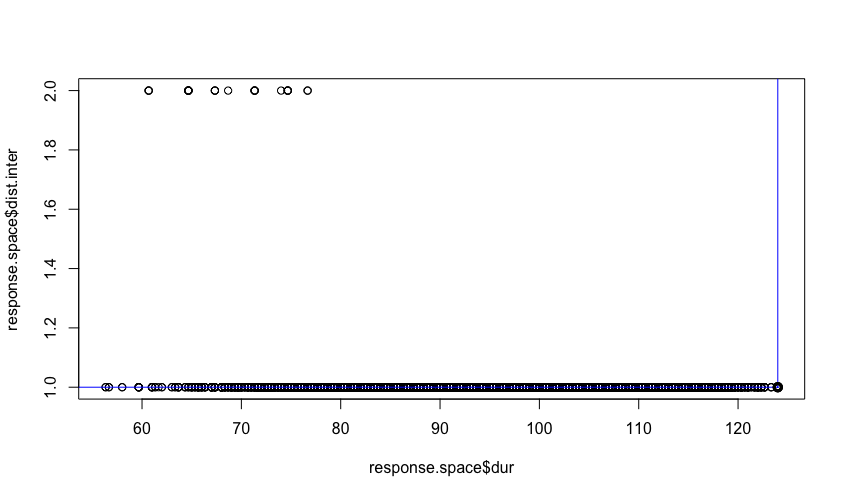
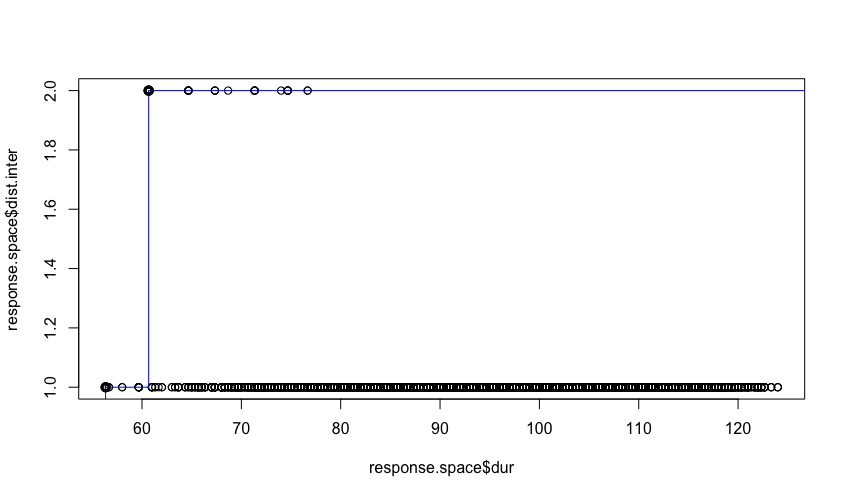
To optimize the maintenance strategies a pareto frontier was computed. The two graphs show the best option based on two different sets of criteria:
- The lowest duration and the highest distance
- The highest duration and the lowest distance
The blue line represents the pareto frontier and the black dots in the far-left upper corner or far-right lower corner, respectively for options 1 and 2, the best optimal solution.
Content:
1. Scope & Integration Context of the Civil System
2. Integrated Maintenance Strategies
4. Multi-Objective Optimization
Downloads:
1. R-Script