LIFE CYCLE ANALYSIS
For this section of the assignment, we are to consider only one design option for each of the systems. Below is a list of the individual systems and the chosen designs along with a brief explanation for why that design was chosen.
- Fire Station: Steel columns were chosen.
- Rigid Pavement:
- Asphalt Pavement: HMA-Overlay was chosen.
- Footbridge: Borate-treated timber was chosen. Out of the two treated design options, I felt this was best by default since the Creosote-treated timber LCI accounted for the recycling of the timber which is beyond the scope of the life cycle analysis.
Just as a quick comparison, based on the main materials used for each system it is obvious that the pavement options will contribute more negatively to the impact indicators due to the use of concrete. Steel and timber are likely to score better with respect to the impact indicators CO2, NOx and SO2; timber does particularly well in the CO2 impact indicator category as trees are considered a natural ‘carbon sink’.
In this integrated context, the rigid pavement is used as the road leading up to the fire station but only the first 250m is considered. The asphalt pavement is used for the bridge approach of the footbridge, so a 9m long, 3m wide, and 0.01m thick slab is considered.
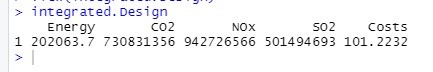
Based on these results it can be seen that greenhouse gas emissions have the most environmental cost with figures of the 9th order of magnitude. The code was run once with the rigid pavement and once without the rigid pavement and it can confidently be said that the rigid pavement performs worst with respect to the environmental impact. Since the goal of this analysis is to minimise the environmental impact, the stark influence of the rigid pavement on the integrated system should be considered carefully when trying to optimise the maintenance strategies. The others should be considered second.
For reference, the units for the different impact indicators were specified as follows:
- Energy MJ/t
- CO2 kg/m3
- SO2 kg/m3
- NOx kg/m3