From the integrated maintenance strategies and life cycle analysis it is clear that there are several parameters to consider, when finding the optimal solution for the maintenance of the system. This can be done with multi objective optimization.
For optimal solution we vary the maintenance strategy by duration time of each maintenance action. For example tunnel.IM = 3-5 days (range). As explained before, one design option and one maintenance strategy were chosen for each domain. Afterwards the life cycle for each subsystem were calculated and also the amount of emissions. Several assumptions were made:
- Function includes cost of construction
- Not included maintenance costs
- Transform emission to cost value
- It is prefered to have low duration time, low emission and in consequence low cost of emission
The following scatter plot (figure 1) shows the entire solution space. It’s clear from this that only the plots in the bottom left corner are interesting to study further, since linear relationships exists for emissions and cost values in the rest of the solution space.
Figure 1: The entire solution space
An optimal solution of duration time (days) based on the aspects above can lead to a maintenance strategy which provides a mercy way with respect to the environment and by this to the cost of company. Below the results are provided:
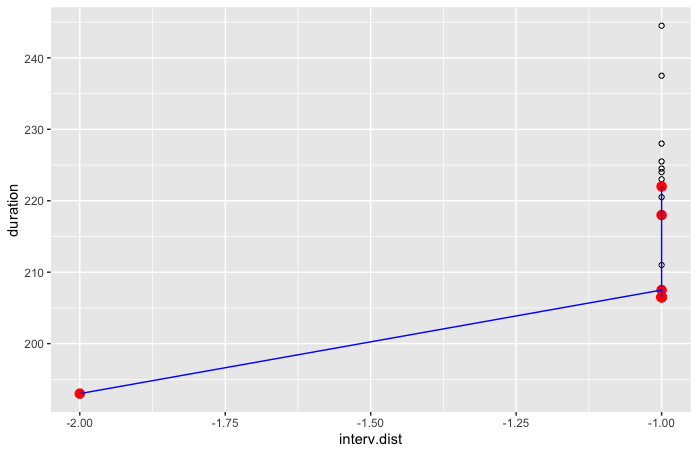
Figure 2: Pareto front for minimizing total duration of interventions (days)
When we have the minimal duration of intervention we save two times the interval of interventions (figure 2).
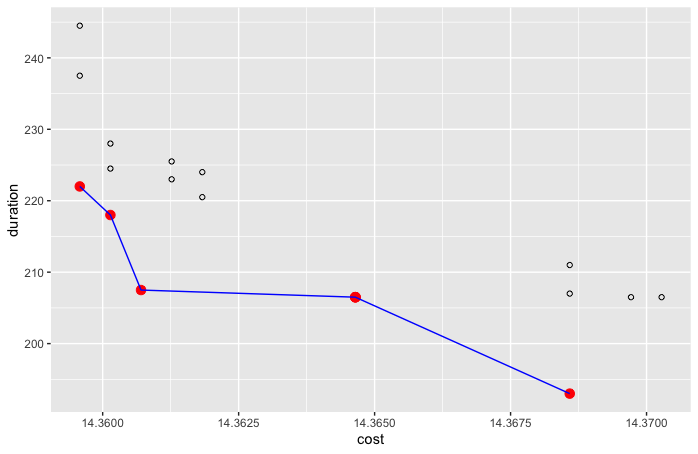
Figure 3: The price (€) for minimized duration of interventions (days)
To minimize the duration of interventions will however costs more (figure 3).
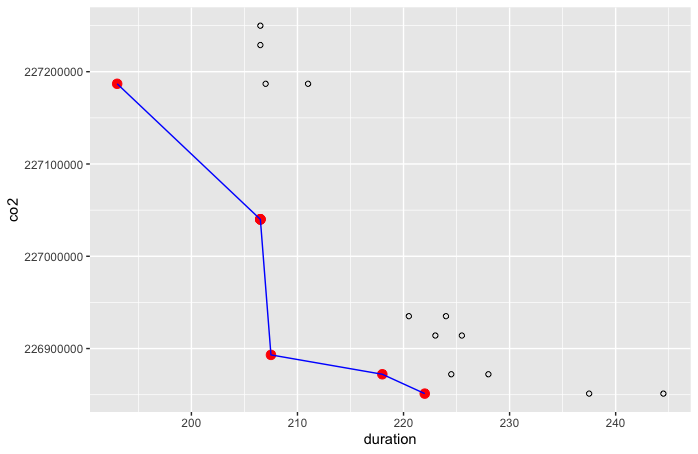
Figure 4: Pareto front for minimize emissions of CO2 (kg) and the duration of interventions (days)
Lower duration leads to higher emissions of CO2 (figure 4) and energy (figure 5). More time means you can choose more CO2 friendlier ways. It could also be because of the different systems. But there is not a big difference between the different options, since most of the emissions comes from construction.
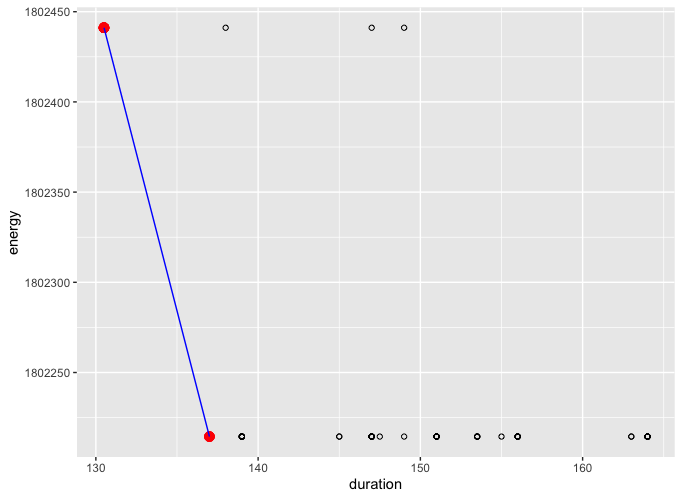
Figure 5: Pareto front for minimize energy consumption (MJ) and the duration of interventions (days)
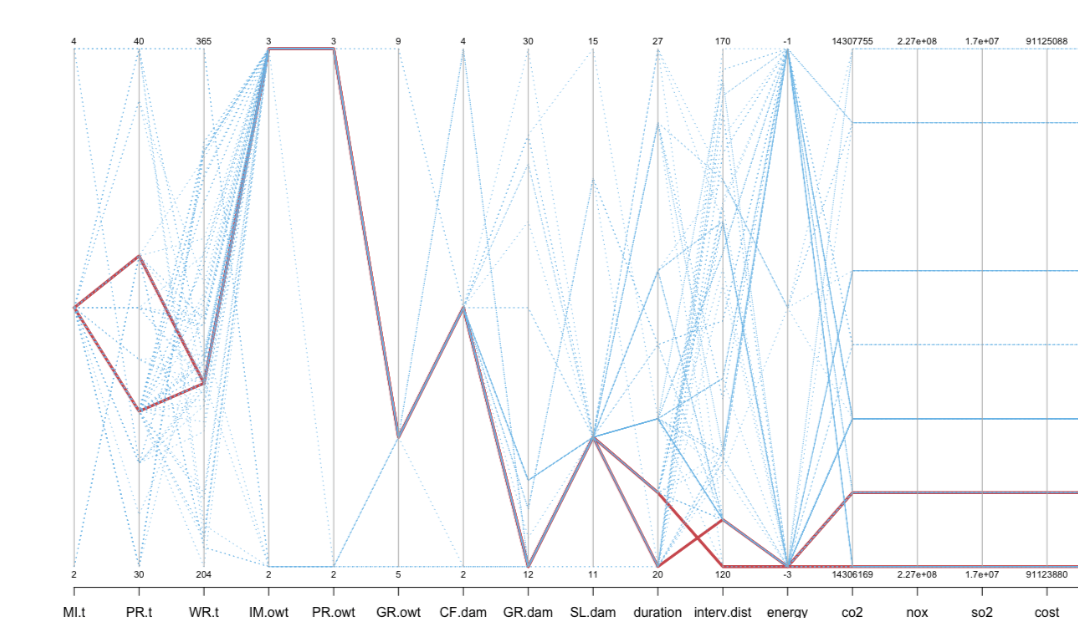
Figure 6: The optimal solutions in red and the non-optimal solutions in blue
For the optimal solution there are ranges for some of the interventions, whereas some are constant. For tunnel.MI the possible range is 3-5 days, but the optimal is always 4 days of intervention (figure 6). When it comes to tunnel.PR the optimal have a range, the duration should either be (about) 34 or 36 days. For the environmental costs they are almost constant for all solutions, which can be explained by the fact that most of the emissions are generated during construction.