Introduction
With pavement overlay system we are going to understand the overlay of the pavement itself and the structure underneath. Pavement systems provide critical infrastructure services to society but also have significant impacts to large material consumption, energy consumption and capital investment. During its lifetime there my be possible failures of pavement sections due to initiation and expansion of distresses such as cracks and rutting.
System deterioration analysis
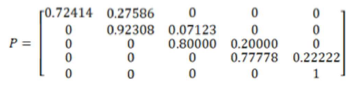
The aim is here to understand how the states of an pavement overlay system change during its lifetime and while using a Markov Chain Model to present the factors causing failure or degradation. A fault tree then shows the possible failure modes and their probability. This analysis also contains an calculation of MTTF (Mean Time to Failure), MTTR (Mean Time to Repair) and of Value of Information.
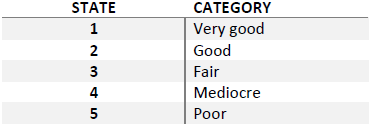
- State 1: no noteworthy deficiencies
- State 2: some minor problems for minor maintenance
- State 3: minor section loss, cracking, minor rehabilitation needed
- State 4: advanced section loss, deterioration, major maintenance is needed
- State 5: out of service
An analysis representing a model during the event of failure including repairs helps to predict the behavior of the pavement system during its lifetime. This way the managers an the responsible engineers can take more easily decisions when it comes to maintenance planing, and all this while including different intervention scenarios and their costs. With a combination of MTTF, MTTR and the Value of Information they analyse different possibilities and can schedule the best plan to maintain the pavement in order to achieve its highest longevity.
Life Cycle Analysis
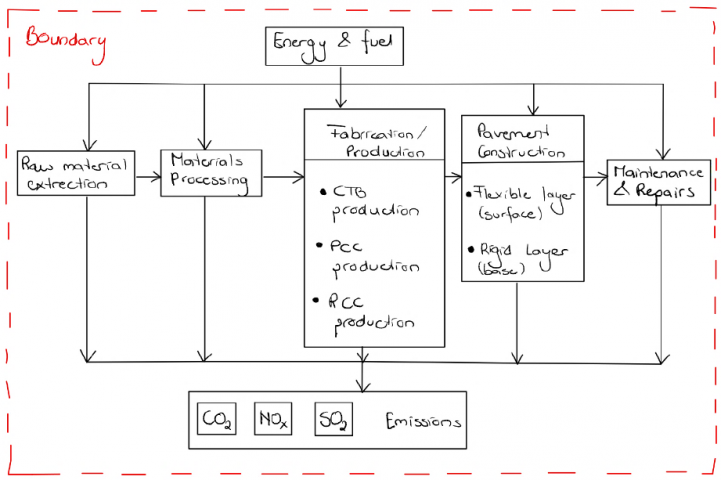
The aim here is to conduct the life cycle assessment of the pavement system firstly by defining the goal and the scope using the information about the materials needed and their quantities.
- Goal: carbon footprint analysis
- Scope: is shown in the figure below together with the systems boundaries
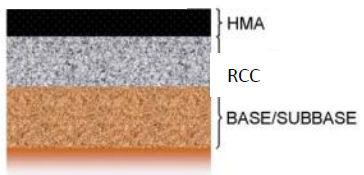
The design alternatives: For each design following materials are needed 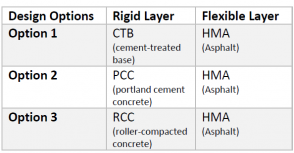
All 3 designs are shown in the pictures below:
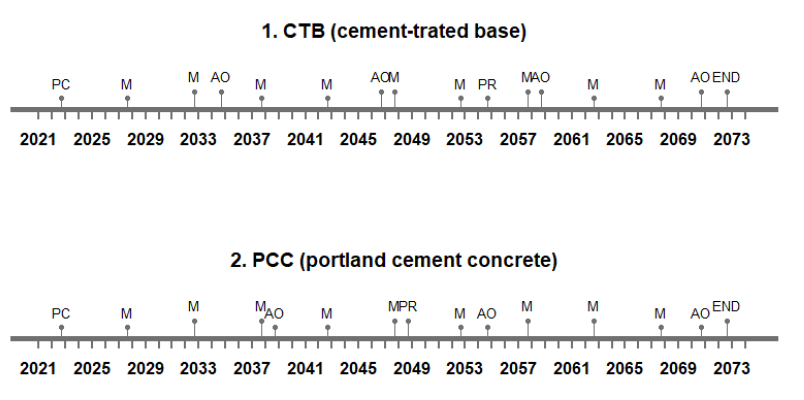
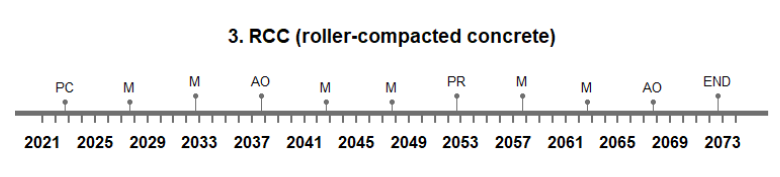
Life cycle timeline
The life cycle timeline hast to represent the life cycle of the design options from the moment they were built (01.01.2023) until their planned end of lifetime (50 years). There are 3 events to be considered:
1- M: is the maintenance which represents interventions like: crack and slurry sealing, pothole patching
and micro surfacing [7].
2- AO: is the asphalt overlay which represents the paving over of an existing asphalt surface
with a new asphalt cross section.
3- PR: full-depth pavement reconstruction.
The below following plots represent the timeline of all three design options.
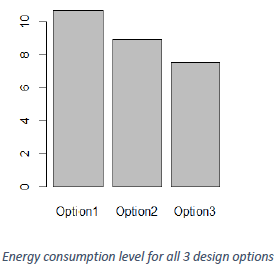
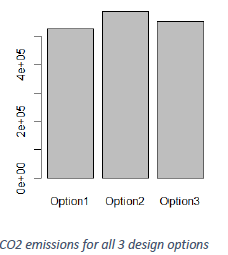
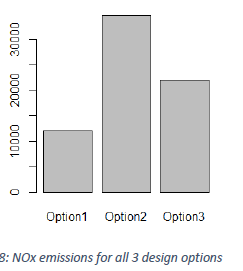
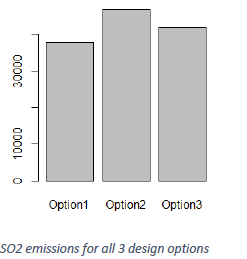
Life-Cycle Inventory
This part of the project includes a life cycle analysis of different pavement options. This analysis is based
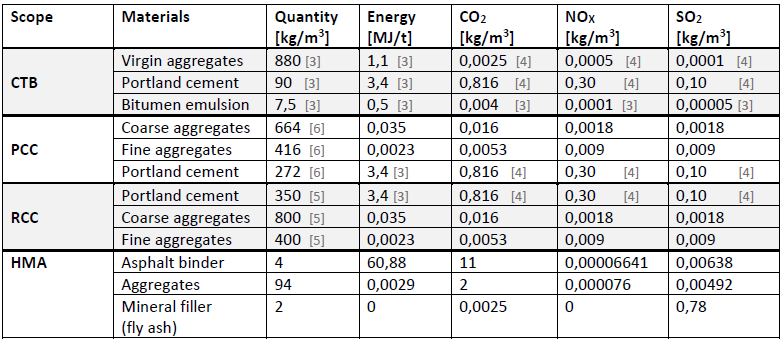
on 1.00×1.00 m pavement with a rigid layer of 20 cm and a HMA Layer (hot mix asphalt) of 17,5 cm. Different options have different materials and while using Table “Composition of materials” it is our goal to calculate the amount of energy and emissions per option. The calculation is then presented in barplots, as shown in the figures below.
Composition of materials:
Radar plot:
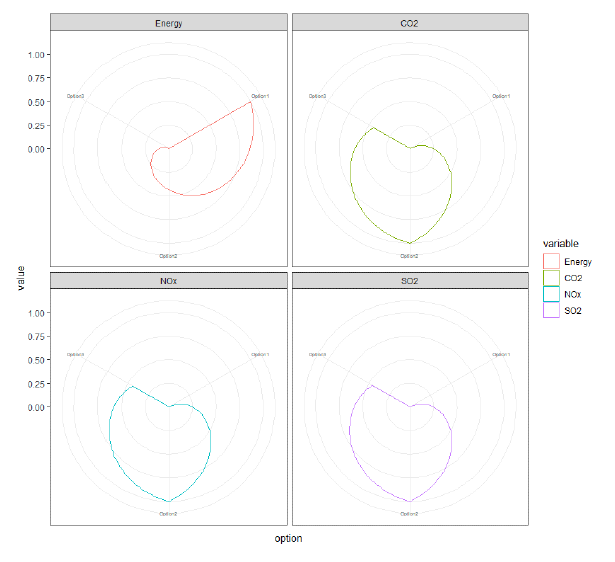
MCDA TOPSIS
In this part we are try the Technique for Order of Preference by Similarity to Ideal Solution. The decision analysis as the name tells, is based on a comparison to the ideal solution. Here we define the energy as the criterion with most importance and SO2 emissions as criterion with least importance.
- TOPSIS 1: which takes into account the results of the analysis above, the weights of the criterions and the minMax criteria.
– TOPSIS 2: which takes into account all the things from TOPSIS 1 and the positive and negative ideal solutions.
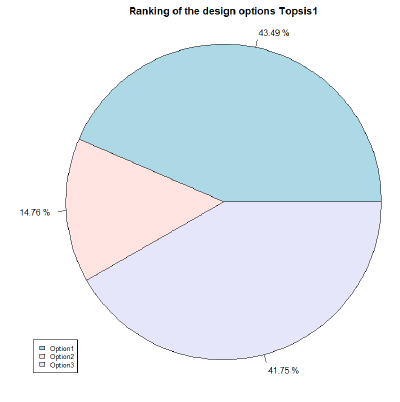
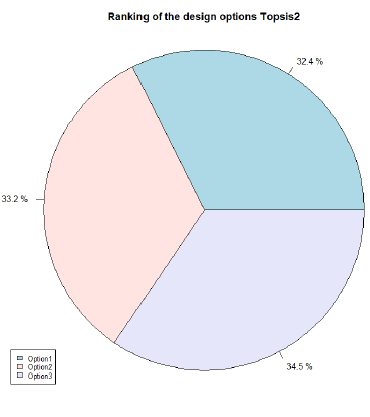
From the anylsis we see that option 1 is the most stable one. It is ranking mostly first at every plot and showing good potential to be the right choice for a pavemnt overlay system. I would suggest that its timeline needs a little bit of changes and a more regular distribution of the maintenance events. But all in all it seems that a CTB, cement-trated base pavement with a HMA surface, is the best design option to choose based on the criteria we defined since the beginning of this assignment.
References
[1] Gerardo W. Flintsch, Ph.D., P.E., Brian K. Diefenderfer, Ph.D., P.E., and Orlando Nunez. Composite Pavement Systems: Synthesis of Design and Construction Practices. Virginia Transportation Research Council, November 2008.
[2] Lim, S., Zollinger, D.G. Estimation of the Compressive Strength and Modulus of Elasticity of Cement-Treated Aggregate Base Materials. Transportation Research Record, 2003.
[3] Sara Bressi, Michele Primavera, Joao Santos. A comparative life cycle assessment study with uncertainty analysis of cement treated base (CTB)pavement layers containing recycled asphalt pavement (RAP) materials. Resources, Conservation & Recycling 180 (2022) 106160. Elsevier
[4] William T. Choate. Energy and Emission Reduction Opportunities for the Cement Industry. Industrial Technologies Program. December 2003.
[5] S.D. Bauchkar, Dr.H.S. Chore. Roller Compacted Concrete. IOSR Journal of Mechanical and Civil Engineering (IOSR-JMCE) ISSN: 2278-1684, PP: 28- 32. December 2014
[6] Steven H. Kosmatka, Michelle L. Wilson. Design and Control of Concrete Mixtures. The guide to applications, methods, and materials. FIFTEENTH EDITION 2011
[7] John T. Harvey, Joep Meijer, Hasan Ozer, Imad L. Al-Qadi, Arash Saboori, Alissa Kendall. Pavement Life-Cycle Assessment Framework. PP:122-130, July 2014.
[8] B. Yu, Q. Lu, J. Xu. An improved pavement maintenance optimization methodology: Integrating LCA and LCCA. Transportation Research Part A 55 (2013) 1–11.