1. Introduction
The building sector has substantial impact on environment. With the extensive use of construction materials, this industry plays a crucial role in resource consumption and environmental stress. According to Ahmed et all (2019) “The construction industry is responsible for several impacts on the site and the region where it installs a particular work. These impacts extend from the manufacture and transport of materials to the execution of a particular project, and they are of environmental, social, and even economic nature”. (The references are given in the Full Report at the end of the page.)
2. Goal and Scope
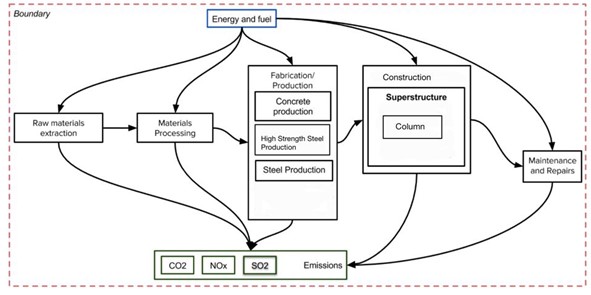
The main goal of this work is to observe the energy use and carbon emissions of the construction of a subsystem of a concrete office building system. The substructure is chosen as column. The scope and the boundaries of the assessment are presented in the Figure 1.
3. Design Options
The design alternatives for a column are shown in Figure 2. Simple-supported column with a load bearing capacity of an axial force of 5000 kN and a bending moment of 100 kNm is considered for this study (Ahmed et all, 2019).
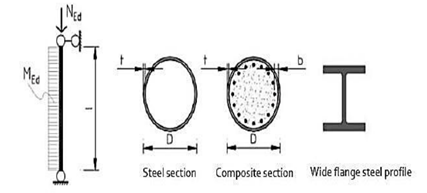
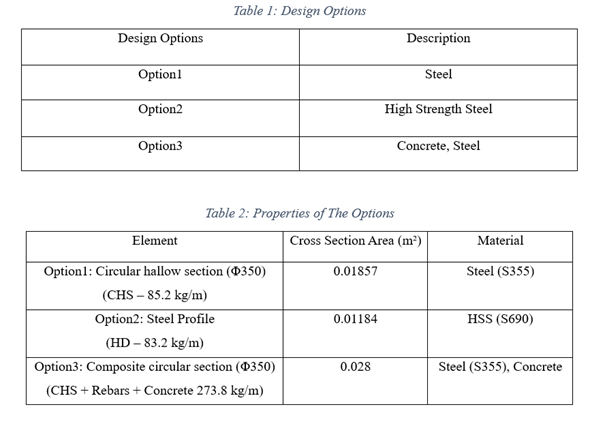
Definitions of the design alternatives is presented in Table 1. The properties of these options also shown in the Table 2.
4. Life Cycle Inventory
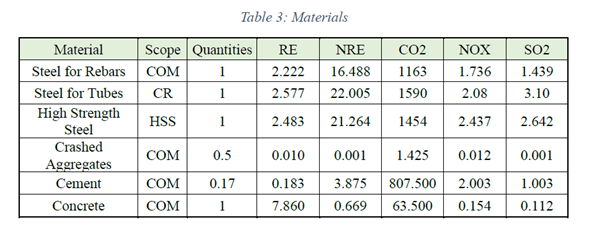
Table 3 presents the composition of different materials used. Data is gathered by Ahmed et all, for each material, encompassing details on energy consumption during fabrication and processing (measured in MJ/t), as well as emissions of CO2, NOx, and SO2 (expressed in kg/m3). The scope column displays the association with various design options. It uses different numbers to represent quantities, each carrying a distinct meaning such as CR = Circular, HSS = High Strength Steel, COM = Composite.
4.1. Life Cycle Timeline
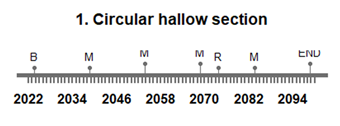
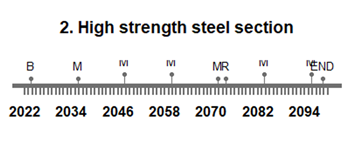
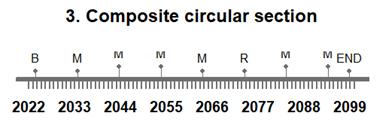
Initiating the life cycle analysis requires establishing the lifespan of the selected system. It is equally crucial to delineate events occurring throughout its lifetime, encompassing maintenance activities such as repairs or rebuilding. In this context, a service life of 75 years has been assumed for both the building and the column. The generated timeline for the Options are shown below in the Figures 3, 4 and 5.
5. Life Cycle Inventory Analysis
The Life Cycle Inventory Analysis for the three options has been completed, and the corresponding results have been obtained and illustrated in the figures below.
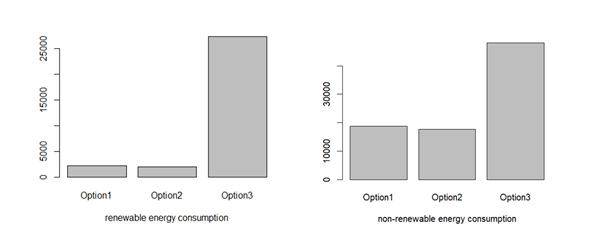
Observing Figure 6, we can discern the energy consumption associated with each design option. Specifically, Option 2, high strength steel section, demands the least energy for both renewable and non-renewable energy. Composite column design requires the highest amount of energy.
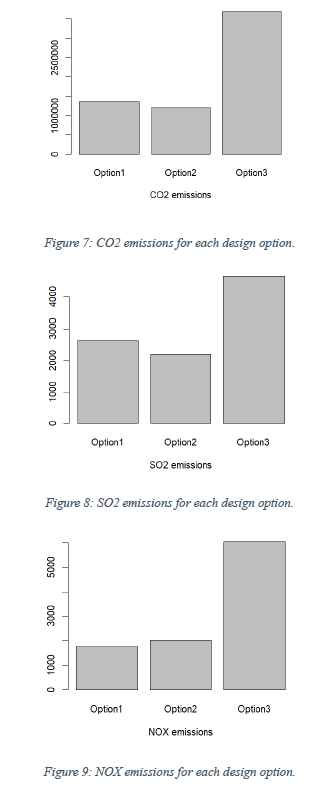
Figure 7 presents the CO2 emissions for each design option. High strength steel section has least emission with circular steel section following it and composite section with the highest emission. The same comments can be made for the SO2 emissions that shown in Figure 8. Figure 8 presents the NOX emissions. Circular steel section has least emission with high strength steel section following it and composite section with the highest emission.
6. MCDA
In this model, the TOPSIS method is used to analyse the system. It is a method of compensatory aggregation that compares a set of alternatives, normalising scores for each criterion and calculating the geometric distance between each alternative and the ideal alternative, which is the best score in each criterion (Wikipedia contributors, 2023). Defined weights for each indicator as follow:
- RE – 15%, NRE – 15%, CO2 – 35%, NOx – 15%, SO2 – 15%
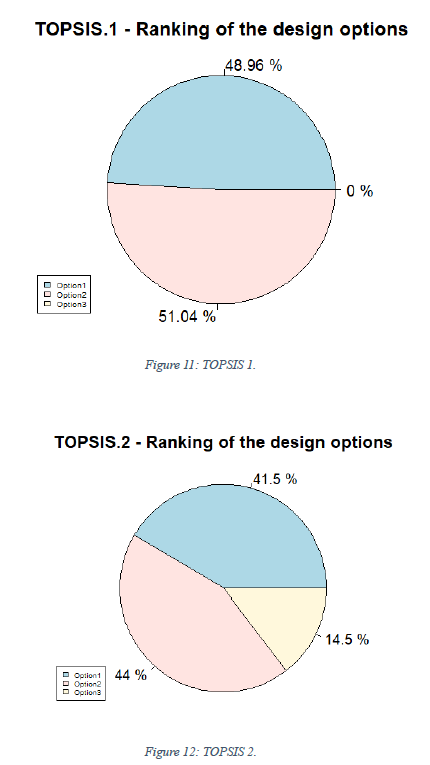
For TOPSIS first method it is decided that the criteria to be minimum for all the indicators. In the second method of TOPSIS, the approach involves comparing alternatives to ideal solutions. The results of rankings are shown in Figure 11 and Figure 12.
Results
These results supporting Option 2 which is high strength steel section can be chosen as best option. Since there is no big difference between Option 1 and 2, Option 1 also can be considered but Option 3 can be seen as least desirable option.
Downloadable Content
Full Report: Oguzhan Erdal
| Main Page | Introduction | Integration Context of the Civil Systems | Maintenance Strategies | Life Cycle Analysis | Multi-Objective Optimization |