Introduction:
Abstract:
As more and more weight is placed on the importance of decisions made during the design phase of a civil system, it is crucial to start implementing data-driven methods that help engineers make better decisions in the early phases of product design. For this reason, this report evaluates different design options of a sub-system during its life cycle based on specific performance criteria. Moreover, a digital implementation of multi-criteria-decision-making methods like AHP and TOPSIS will be used to make informed decisions on the best design option.
Chosen System:
The chosen civil system as a proof of concept for this report will be a Roof Terrace. As a structure that is typically subjected to outdoor conditions, the choice of material plays an important role in the system’s life cycle as it dictates the amount of maintenance needed, thus directly affecting the associated costs. Moreover, different structural systems may affect the system’s longevity as they consume different amounts of materials and resources.
Design Options:
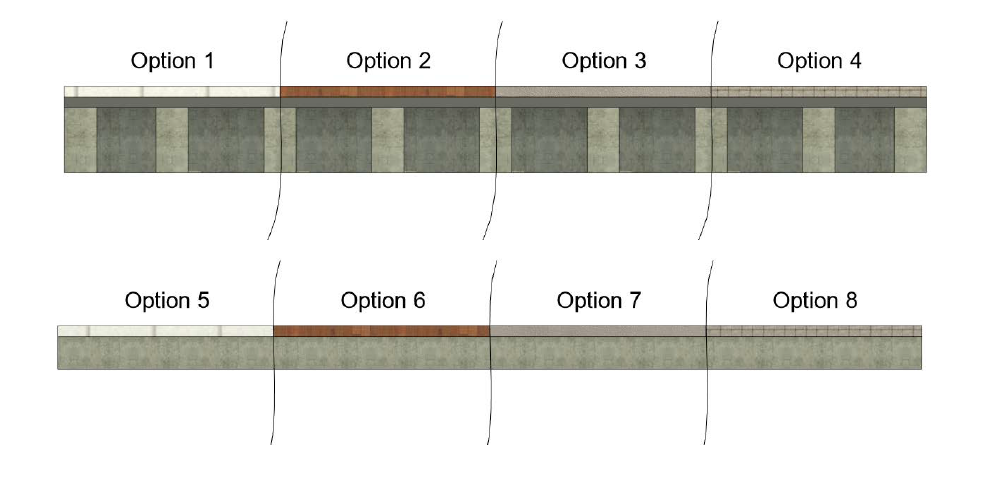
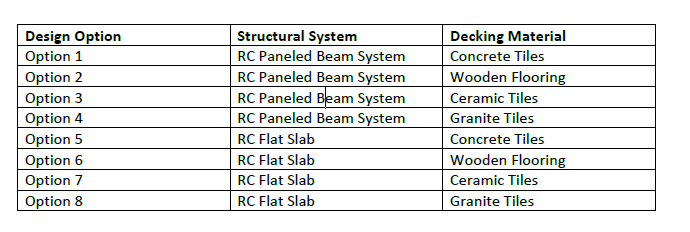
As proof of concept, design options will be considered only for the flooring and the structural slab of the roof. Insulation layers will be ignored for the sake of simplicity. The following diagram and table demonstrate the different design options applied in this report.
Life-Cycle Timeline:
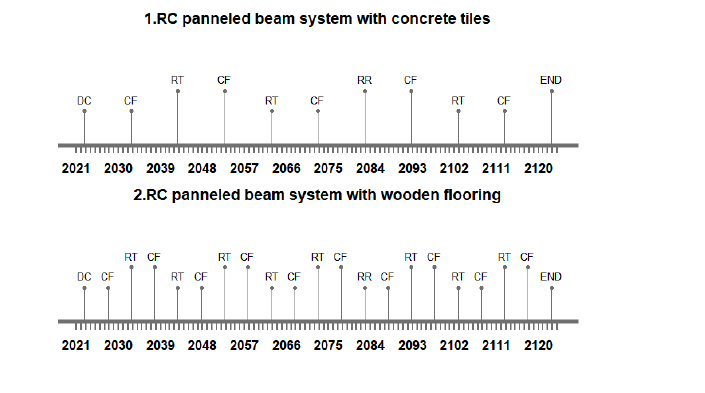
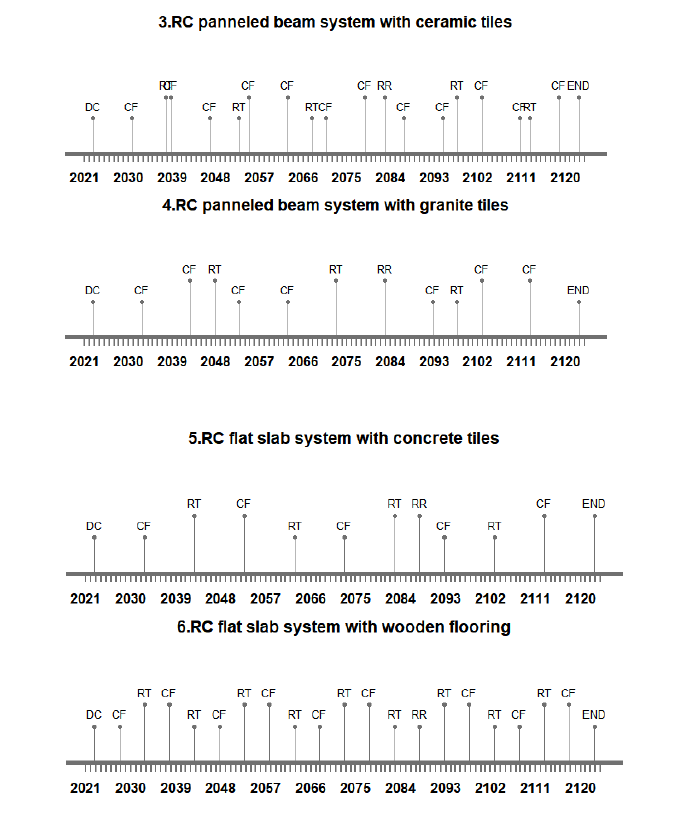
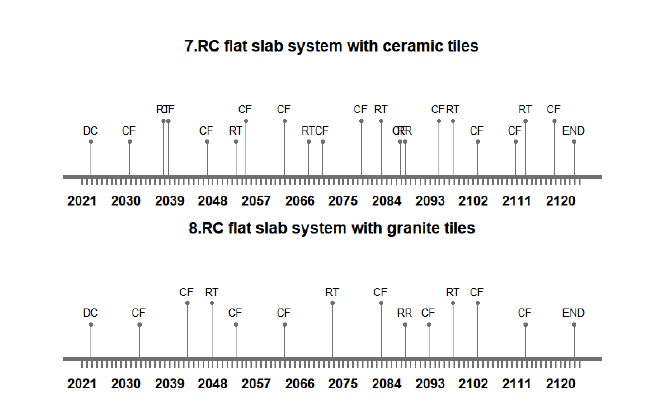
On average, a terrace slab should last about 100 years. However, the flooring is an element that requires periodic maintenance. In some cases, materials might need to be replaced, which adds to the life cycle costs of the system. The following timelines show the interventions needed to be taken along the life cycle of the system.
Please note the following abbreviations:
• CF = Crack Filling
• RT = Replace worn-out tiles
• RR = Replace Corroded Reinforcement
Performance Boundaries:
As mentioned before, the best design option will be chosen according to certain performance criteria. In the case of our example, design options are evaluated according to the amount of energy needed to extract, process, fabricate, produce, construct, and maintain the materials as well as emissions produced that include CO2, NOx, and SO2.
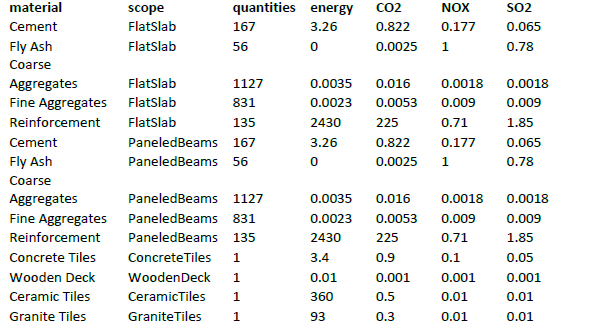
Life-Cycle Inventory & Analysis:
A life cycle inventory (LCI) is a detailed analysis of the inputs and outputs of a product or process over its entire life cycle. The goal of an LCI is to identify and quantify the environmental impacts associated with a product or process, including emissions to air and water, energy consumption, and waste generation. The following table demonstrates the respective values. Please note that the unit of measurement used for energy is (MJ/t) and for emissions is (kg/m3). The quantities of materials for reinforced concrete elements are the amount needed to produce 1 cubic meter of RC, while that of the flooring element directly translates to one cubic meter of material.
Life-Cycle Cost Analysis:
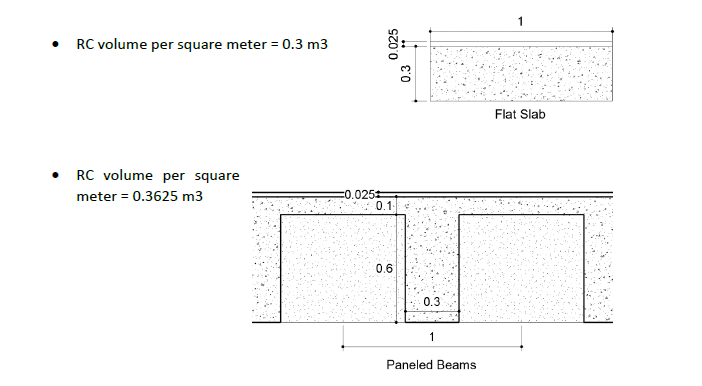
As the performance criteria for the report are set to be energy consumption and emissions, they will be represented as the cost indicator of the system. To calculate this accurately, the volume of all materials used was first calculated according to the geometrical parameters of each material. Firstly, note that the total area of the examined system is 96 m2 and the thickness of different types of flooring is fixed at 2.5 cm. The following diagrams demonstrate the key dimensions for the volume calculations.
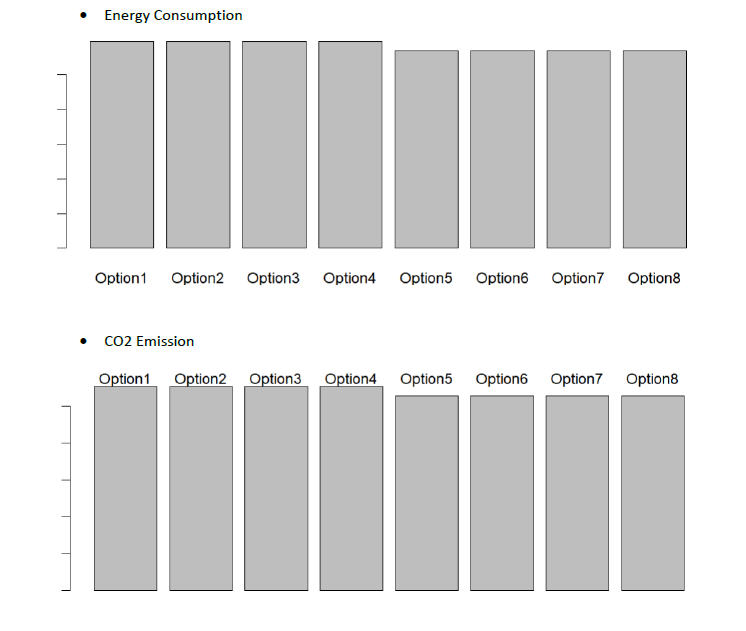
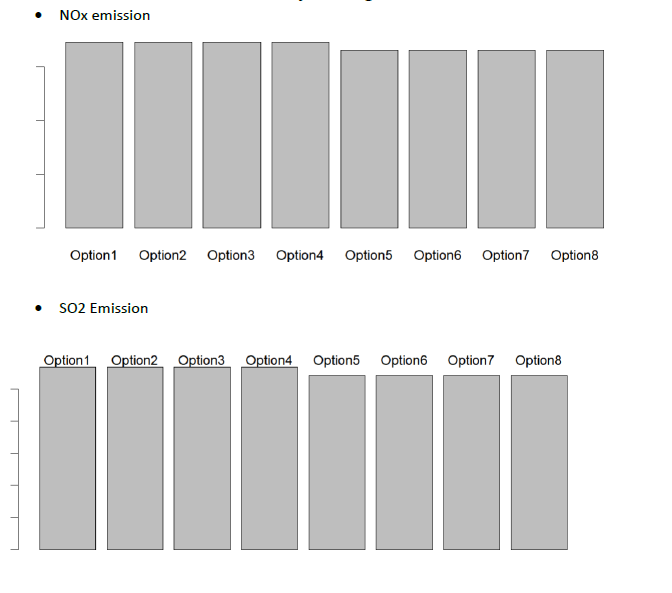
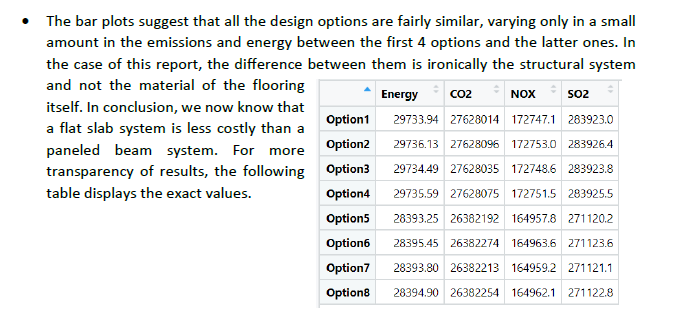
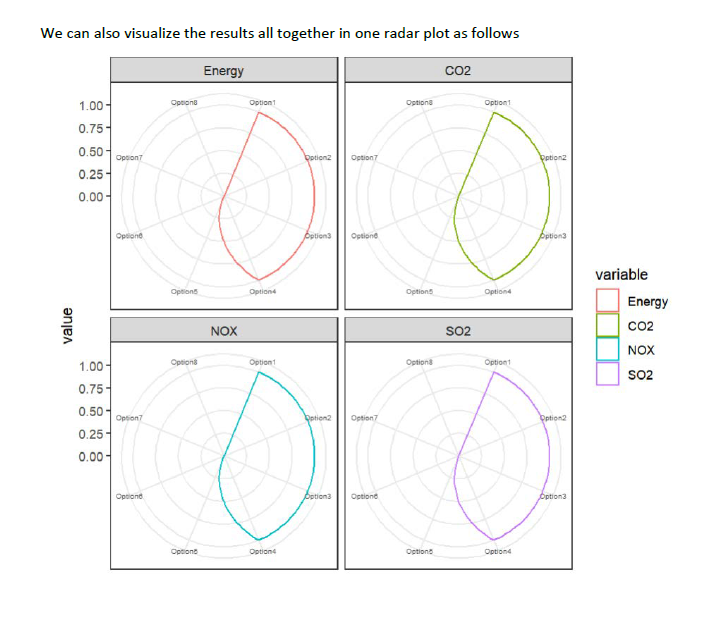
Then, taking as input the total volume of all materials and the number of interventions for each design case, a function in R calculated the resulting amounts of energy consumption and emitted toxins. The following bar charts describe the results with respect to each performance criterion.
MCDM:
AHP:
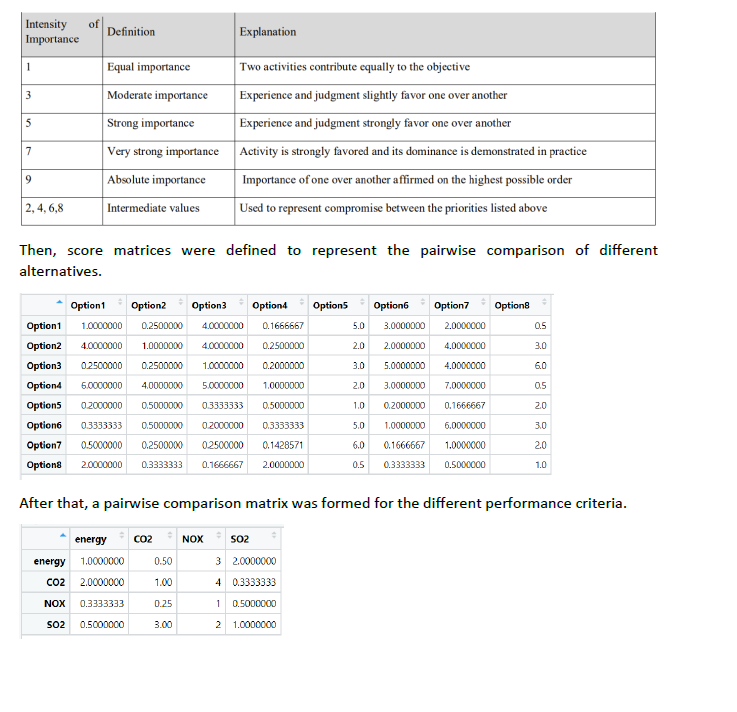
The Analytic Hierarchy Process is based on the idea that decision problems can be broken down into a hierarchy of elements, with each element representing a different aspect of the problem. These elements are then evaluated and compared with one another, based on certain criteria, to determine their relative importance. Firstly, pairwise comparison values were defined based on the 1-9 Saaty’s scale as seen in the table below.
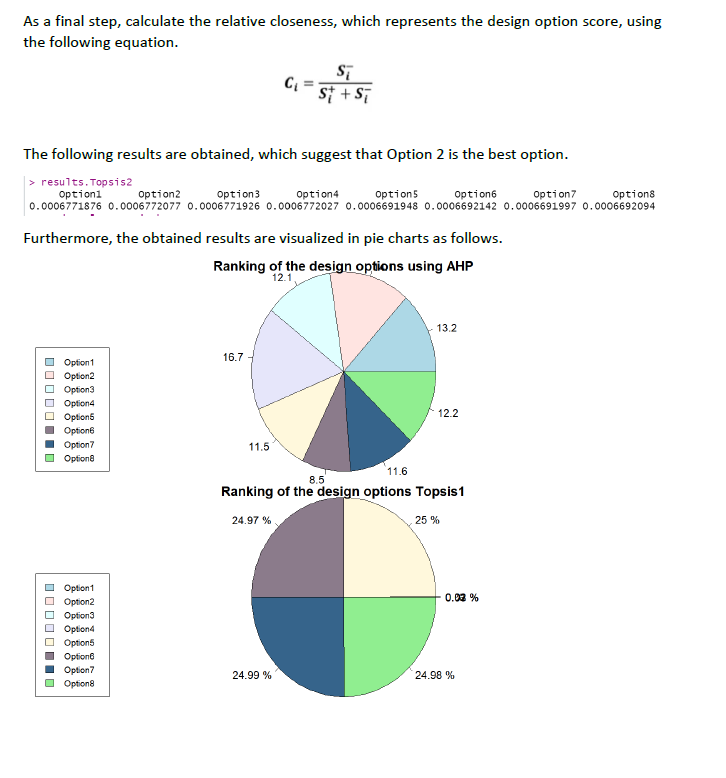
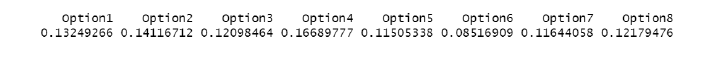
The final step is to apply the AHP() function in R, given the two previous matrices as input to produce scores of which the highest will be considered the best design option. The following results were obtained from the experiment. The results suggest that option 2 is the best. One can argue that this a more accurate result as some values were given more weight according to their importance.
TOPSIS:
As a comparison between the two MCDMs, AHP and TOPSIS are methods based on different concepts. AHP is based on weighted aggregation and its criteria and alternatives weights are obtained by pair-wise comparison and DM preferences. TOPSIS is based on distance. That is, it is assumed that there is an ideal and non-ideal solution.
TOPSIS method can be executed without taking the comparison of the ideal best and ideal worst into account using an R function that takes the results matrix and the criteria weight as input which yields the following results.

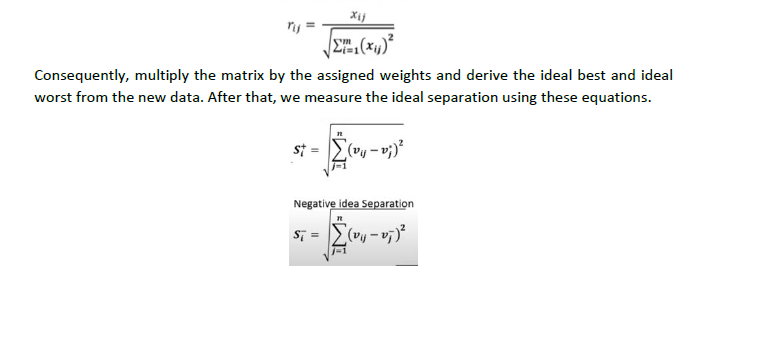
The results suggest that option 5 is the best option, however, it would be more accurate to add in the comparison with the best ideal and the worst ideal scenarios. For this, I created a function in R to calculate them. The first step of which is vector normalization, which is achieved through the following function.