RISK-BASED ASSESSMENT & SYSTEMS CONDITIONS.
The chosen system is a 57-meter-long suspended pedestrian footbridge made of timber that connects two rural communities –Muhondo and Rwinkuba, Rwanda. An analysis of the reliability of this bridge is conducted. This includes how the system degrades over its lifetime as well as failure modes it may be susceptible to. Since timber could be locally sourced, this was the chosen material for the bridge. Timber is a relatively sustainable option, but as a natural construction material is more vulnerable to defects and the environment. This means that the life span of a timber bridge is considerably shorter than that of a steel or concrete bridge, for example, and estimated to be around 30 years.
From the results obtained after the assessment was carried out, it is found that the consideration of repairs vastly improves the prospects of the system. Note that the trend for the ‘excellent’ condition state is more or less the same as before, which is mainly due to the assumption made earlier that the system does not return to this state, even after repairs. On the plus side, however, the probability of states when the bridge is in ‘good’, ‘fair’ or ‘poor’ condition become a lot more stable, especially after 10 years into its lifetime. The system is now much more likely to be in a ‘good’ condition state at around a 50% chance. In comparison, the chance of the system being in ‘fair’ or ‘poor’ condition lies at around 25%.
LIFE CYCLE ANALYSIS & MULTI-CRITERIA DECISION ANALYSIS
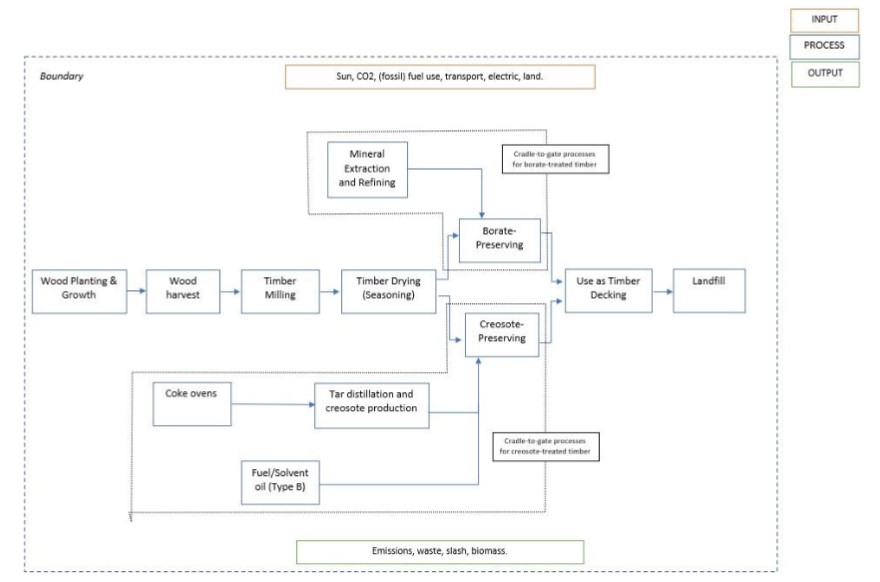
The main goal of this Life Cycle Assessment (LCA) is to investigate the environmental impact of different timber treatment methods, namely oil-based and waterborne treatment methods.
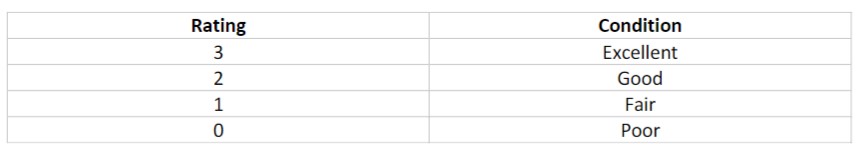
The below table represents the possible states of a Suspended Pedestrian Footbridge during its lifetime:
A summary of the three design options that are compared in this analysis is summarised in the table below:
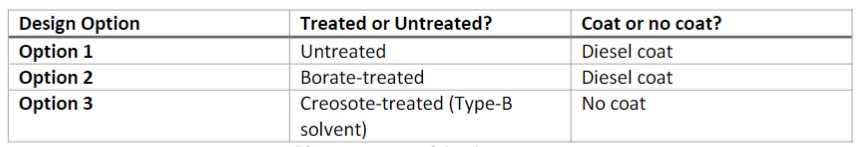
Option 1 reflects the original design of the timber decking. The dimensions of the timber decking boards are also the same across the different design options and as a standard are 5cm by 20cmeach (Bridges to Prosperity, 2016). The deck is 5 planks wide, so in total, the cross-sectional area of the deck is 0.05 square meters and the volume across its 57-meter span is 2.85 cubic meters.
Life Cycle Timelines: Since there are different design options, the corresponding life-cycle timelines will vary slightly. The lifetime is taken to be 30 years as per Individual Assignment One and the events, i.e., the interventions, are defined as Deck Construction (DC), Maintenance and Upkeep (M/U), Deck Replacement (DR), Scheduled Technical Inspection (STI), and Reapplication of coat (RC).
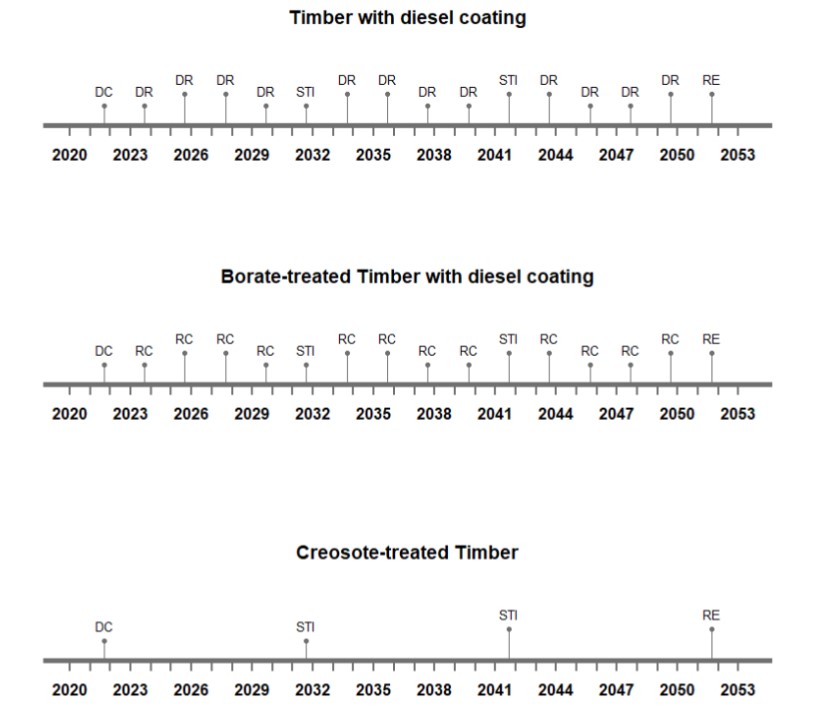
These plots do show the frequency of the interventions, they do not show the interventions that overlap. For example, in design option one, we defined two events that occur with a frequency of two years –deck replacement and reapplication of the coat –however, the plot only shows deck replacement. This is one of the drawbacks of the timelineS function in R.Another example of missing events from the plots includes the two STIs that should take place within the first five years of deck construction. Therefore, it is suggested that the bullet points above are referred to for reliable information.
Life Cycle Inventory: Diesel is not included as a material in the LCIsince the volume of diesel used compared to the volume of the timber deck is negligible and consequently its LCI.
The blow table depicts the Life Cycle Inventory for each option:
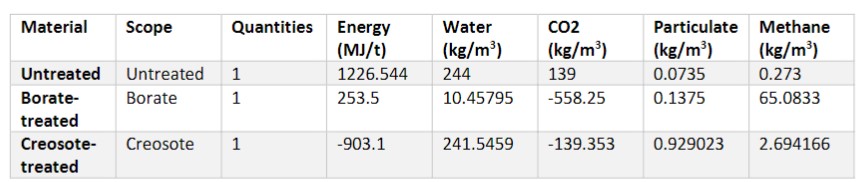
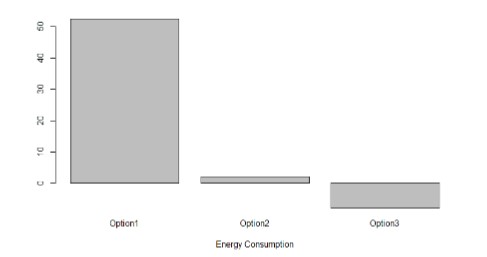
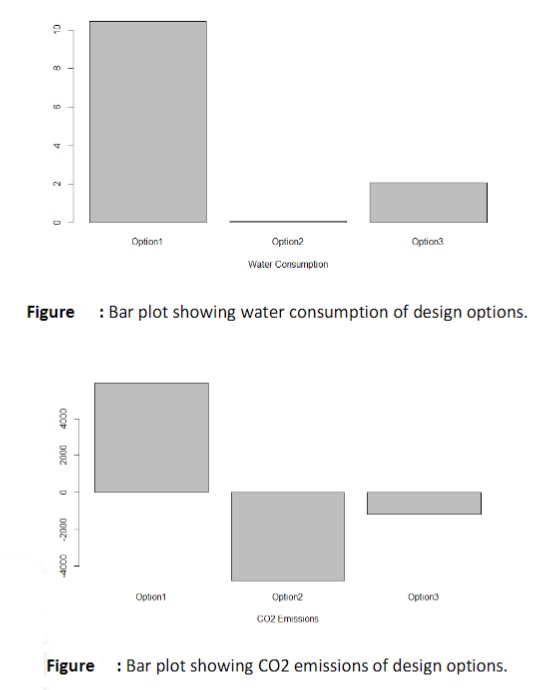
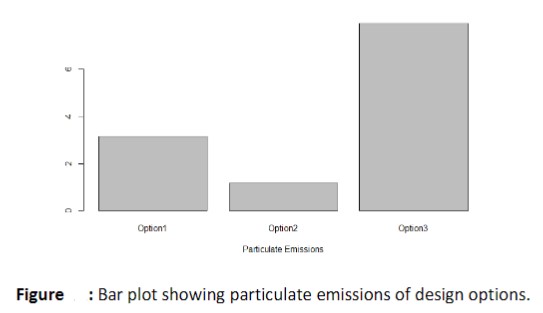
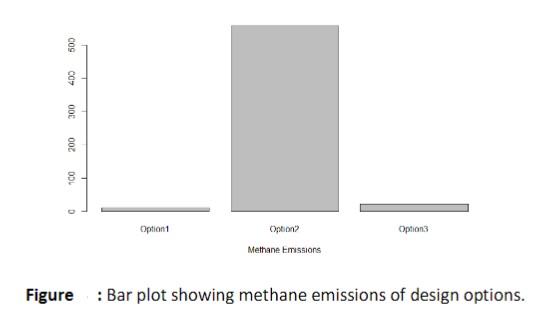
The bar plots that were obtained are as follows:
Barplot showing energy consumption design options.
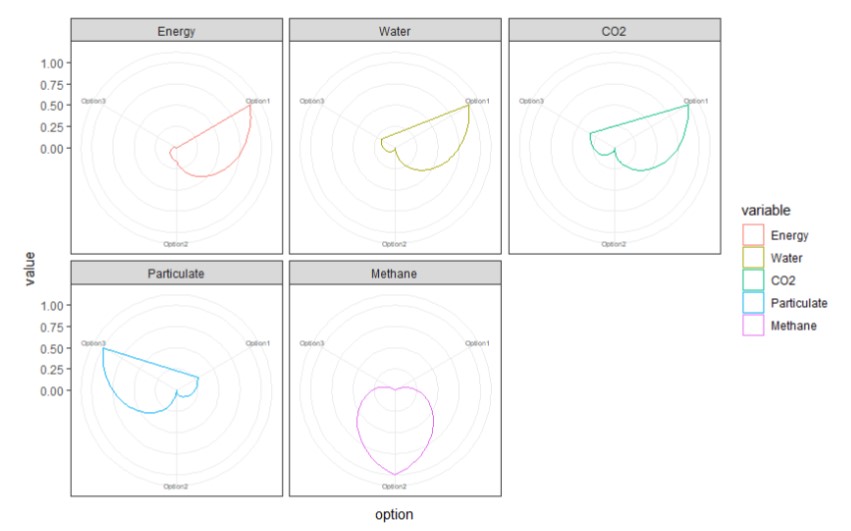
Radar Plot:
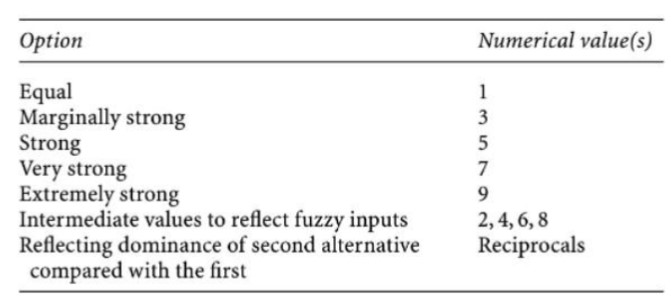
Multi-Criteria Decision Analysis: The Analytic Hierarchy Process (AHP) is a type of multi-criteria decision analysis that reduces the decision-making process to a more local scale. The different design options are compared against each other with reference to one impact indicator at a time. Separately, the impact indicators are also compared against each other.
To represent these comparisons quantitatively, a scoring matrix is generated as shown below:
The below figure represents the ranking of the design options using AHP:
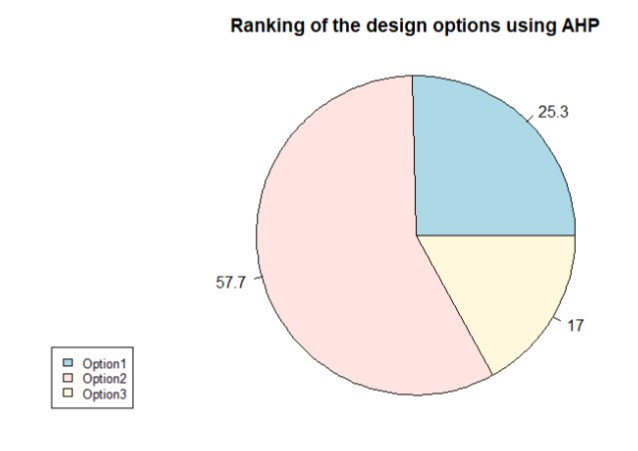
Atthis stage, option2 is thebest option.This is likely due to how well the borate-treated timber performs with regard to the CO2 criteria, at least according to the raw data. The data from the LCIwas used to generate the score matrices of the design options and then the engineer’s intuition for the score matrix of the criteria. Any inaccuracies in the life cycle inventory, which were briefly commented on earlier in the report, will therefore present themselves in this AHP, compromising the reliability of the results.