1. Introduction
In the times of climate change, it’s increasingly important to minimize environmental impacts. This can be achieved by enhancing road design, taking into account the entire life cycle of various designs. This approach enables making well-informed choices using decision-making frameworks. Utilizing specific indicators can help in quantifying criteria, assisting maintenance planners in evaluating the impact of each option. Since various designs involve different materials and maintenance strategies, their environmental effects change as well. (The references are given in the Full Report at the end of the page.)
2. Goal and Scope
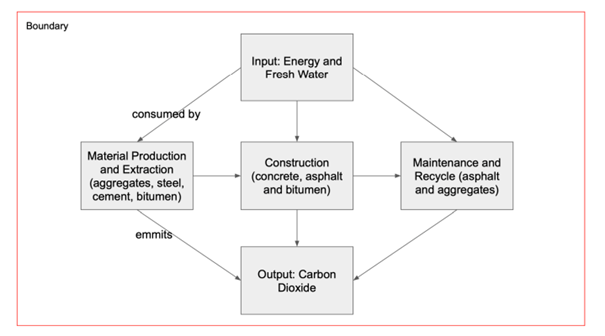
The goal for the analysis is to evaluate the environmental impact of road construction and maintenance of different pavement options. This can help to understand the implications of material production, construction, and recycling practices in the early design stage, where the biggest impact can be made. Comparing energy consumption is important, because road construction generally requires a lot of energy and using techniques that need less energy is favorable, as it contributes to greenhouse gasses. Measuring greenhouse gas emissions is a key environmental indicator as it directly influences climate change, due to their gasses warming potential. Fresh water is a limited source and gets more scarce the more climate change progresses. It also requires a lot of effort to process it. Reducing that also makes a positive impact on the environment
The boundary outlined in red shows the entire process, starting from the extraction and production of materials like aggregates, steel, cement, and bitumen, moving to the construction phase involving concrete, asphalt, and bitumen application and finally covering maintenance and recycling processes for asphalt and aggregates.
3. Design Options
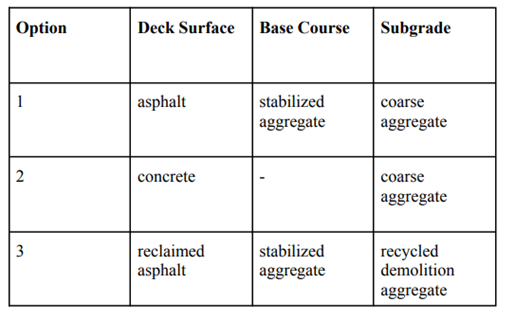
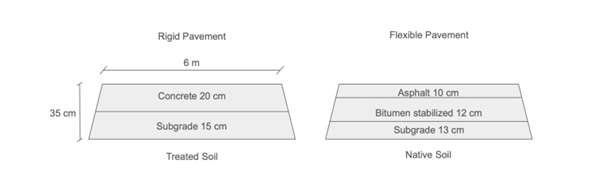
In this case the functional unit is a 1 km long, 6 m wide and 0.35 high segment of pavement. Each pavement option has individual layer thicknesses as well as materials, which directly impacts their performance. The first option is a type of flexible pavement. Its deck is made of hot mixed asphalt and its base layer is bituminized aggregate. The subgrade layer is a coarse aggregate made of crushed stone. Similarly, option 3 has the same structure but different materials. The deck uses reclaimed asphalt, the base is also from bituminized aggregate and the subgrade is made of recycled aggregate from demolition. On the other hand, option 2 is a type of rigid type pavement.
4. Life Cycle Inventory
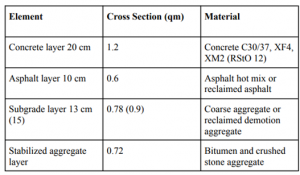
The table below shows factors of all compositions of the options. Composition density describes how much mass is in one cubic meter of each composition.
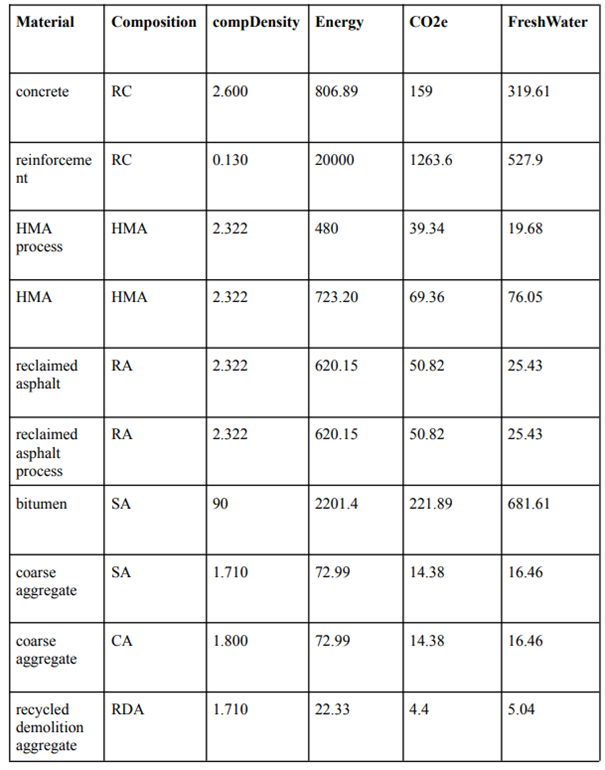
- RC = reinforced concrete
- HMA = hot mixed asphalt
- RA = reclaimed asphalt
- SA = stabilized aggregate
- CA = coarse aggregate
- RDA = recycled demolition aggregate
- density of composition in t/m³, energy in MJ/t, CO2 in kg CO 2 e/t and freshwater l/t.
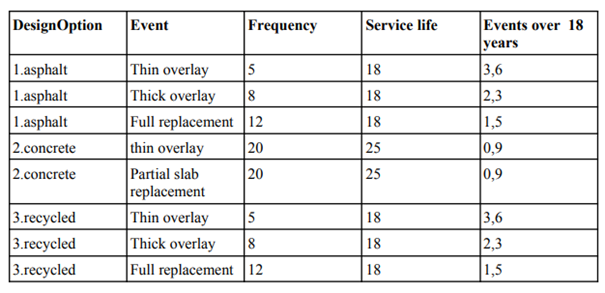
5. Life Cycle Timeline
The timeline below shows the different maintenance actions over the years. It stands out that flexible pavement needs more frequent repair due to the fact that concrete is more durable that the asphalt layer. The time span for material calculation has been selected for 18 years. Option 1 and 3 have the same frequency as they are both flexible pavement.
6. Life Cycle Analysis
The images represent the results of the life cycle cost analysis. For each option the mass of each layer has been calculated and multiplied with their corresponding factors. This results in the total amount for each indicator to build one kilometer of pavement. The materials mass for maintenance has been implemented by adding the additional materials for each intervention and multiplying with its frequency for the selected time span.
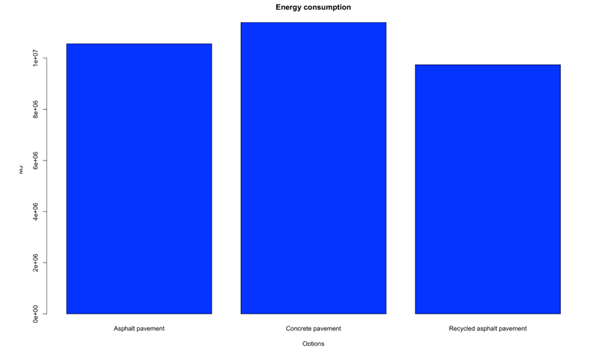
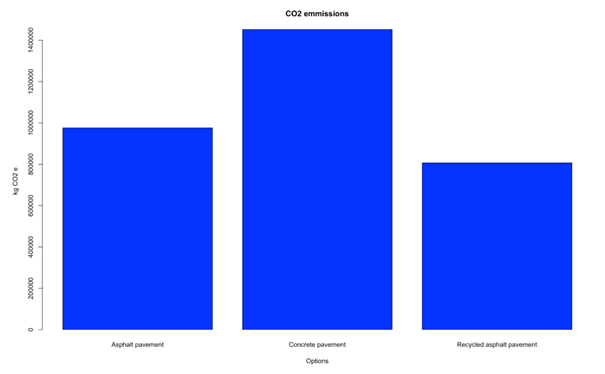
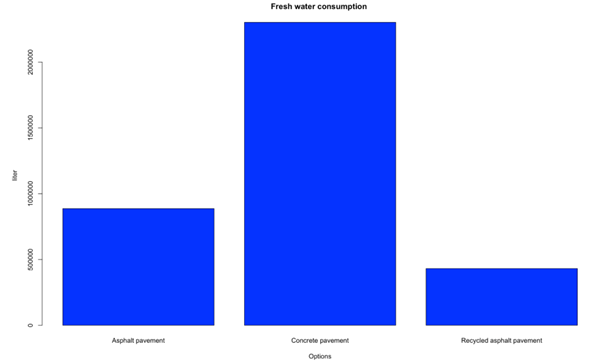
The concrete option is in all three categories the worst performing, considering the previous boundary. In energy consumption all three options are arguably similar. In carbon dioxide equivalent emissions, asphalt variants outperform the concrete pavement significantly but being similar compared to each other. In fresh water consumption asphalt variants are substantially less than concrete. Recycled asphalt performs significantly better than regular asphalt in this case.
7. MCDM Analysis
Below the pairwise comparison is presented in the image. The weights are selected based on the analysis of the bar plots rather than using the exact values from the LCC analysis. Here for energy option one is slightly better than option 1 and two. For greenhouse gas emissions recycled asphalt is significantly better than both at a different scale having the score of 2 and 5. In terms of water score alternative 3 is substantially better than concrete significantly better than option being assisted 8 and 9 to it.

The pie chart represents the result of the AHP method. With a total score of 59 it is the best performing option 3 achieving the goal under the set of criteria and under given weights.
8. Discussion
Overall, recycled asphalt is clearly the best option if the goal is to mitigate environmental impact considering materials extraction, production, construction and maintenance. Even the fact that concrete is more durable does not provide enough savings to outperform asphalt. The reason is mainly that concrete and reinforcement has such high factors.
What makes recycled asphalt so environmentally friendly is that it reduces the price for each material, especially the asphalt layer, which contributes the most to the negative impact. It is because resources and emissions from materials extraction and production are cut. Also, as the aggregate is recycled it also contributes to better performance.
Downloadable Content
Full Report: Volodja Savchuk