 Pareto Front: Total Duration of Interruption vs. Cost
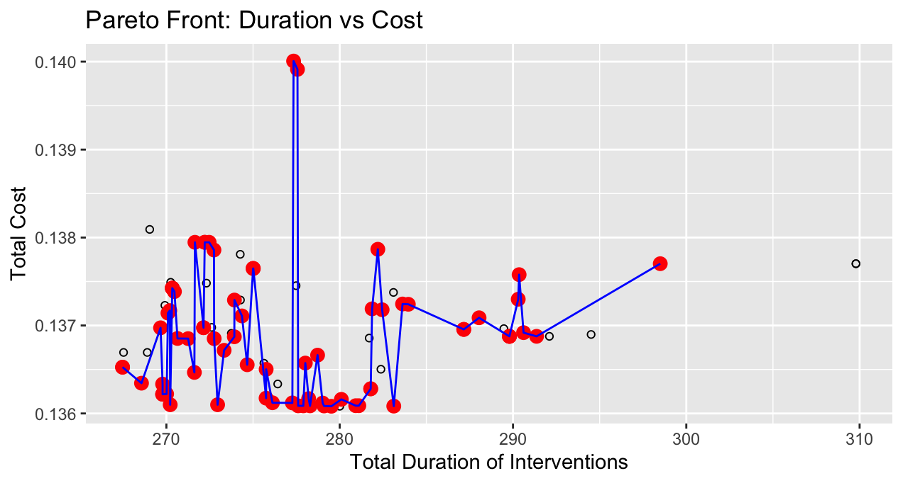
Cost of emissions was assumed based on the tutorial (Abdelfattah, 2024). If the objectives are to minimize total cost and the total duration of intervals only, the Pareto Front would look like below. The Pareto Front is highlighted with red points and connected with a blue line. These points represent the Pareto optimal solutions, meaning no solution is better than these points. This is why there is no point lower (representing lower cost) or more to the left (representing lower duration of maintenance events).
By analyzing this graph, we can make engineering decisions. If the engineering team needs to prioritize having the lowest total duration of system interruption, the engineer can choose the point that is furthest left. If lower duration is prioritized over cost, we recommend the leftmost point.
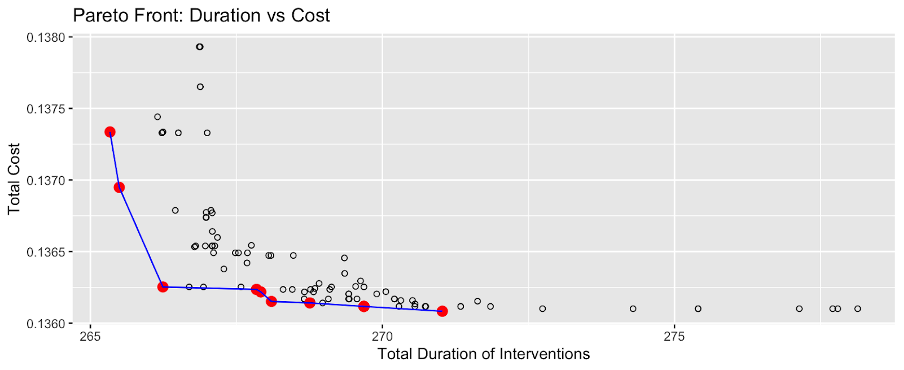 In our application of this model, we are choosing to prioritize lowering the duration of total maintenance events over cost. Again, our application of the model is a town in the Alps where we are considering accessibility. Our reasoning is the following:
- In a project in the Alps, they would not be considering costs as a driving factor because they have a lot of monetary resources. Thus, shutting down essential water infrastructure can be prioritized.
- As mentioned previously in other website sections, it is important to minimize downtime of the system because lack of water infrastructure impacts accessibility. So, this is an additional reason why we are choosing the leftmost point. As we mentioned before, we have made the system have 2 sets of steel water tanks, pipes, and primary sedimentation tanks so that there is no water shutoff during maintenance. However, water will still need to be conserved during this period, so it will still impact the customers.
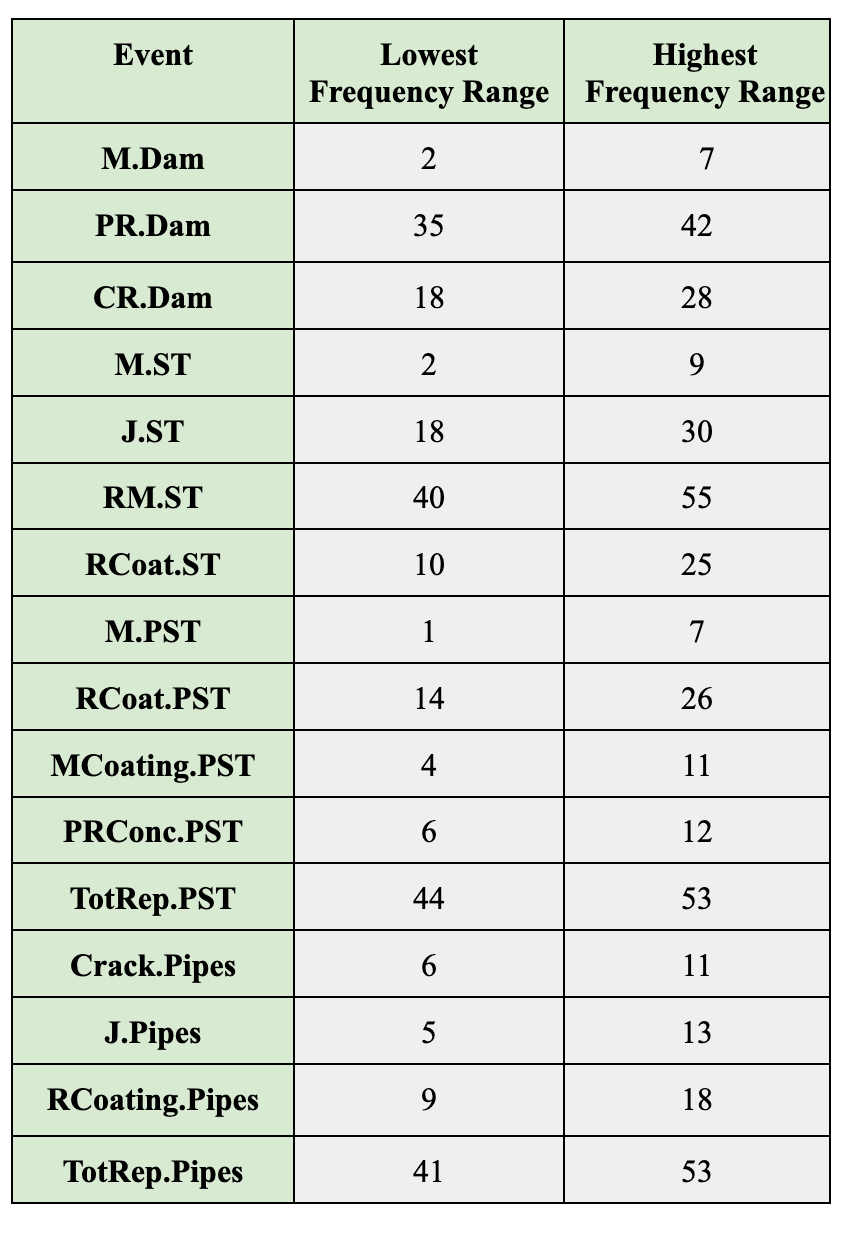
It is important to note that the above Pareto front only shows the Pareto front for optimizing costs and duration of interruptions. If we also wanted to optimize frequency of maintenance events and emission/energy consumption, we would look at the Pareto Front below which looks significantly different. This graph is included only to show that since we changed the outputs one most should be optimized, the Pareto front will change. This graph could be used for engineering recommendations to find points which are in the Pareto Front and slightly favor TotalCost compared to TotalDuration, or vice versa.
However, we cannot understand the entire Pareto Front from this graph. To understand the entire Pareto Front for the 16 maintenance event input parameters and the 7 output criteria (Energy, CO2, NOx, SO2, Cost, Frequency of Maintenance Events, Duration of Maintenance Events), we must look at the next section including a Parallel Coordinate Plot.
Parallel Coordinate Plot of Design Parameters and Objectives
The below plot shows all Pareto Front optimal solutions in red and all Pareto suboptimal solutions in blue. By following one line, an engineer can see how the Pareto optimal solution that is the best for one parameter impacts other parameters. For example, if an engineer wants to decrease the total duration of maintenance events across the system’s 100 year lifetime, the engineer can identify the lowest Pareto Front solution at the Duration line and follow this solution to see what the other parameters would be in this situation.
By running 20 generations with population sizes of 100, there were 72 Pareto optimal maintenance schedules. Reflecting, our group considers this a good choice because the code runtime was not extremely long, and there were a significant amount of Pareto optimal schedules.
Recommended Maintenance Schedules:
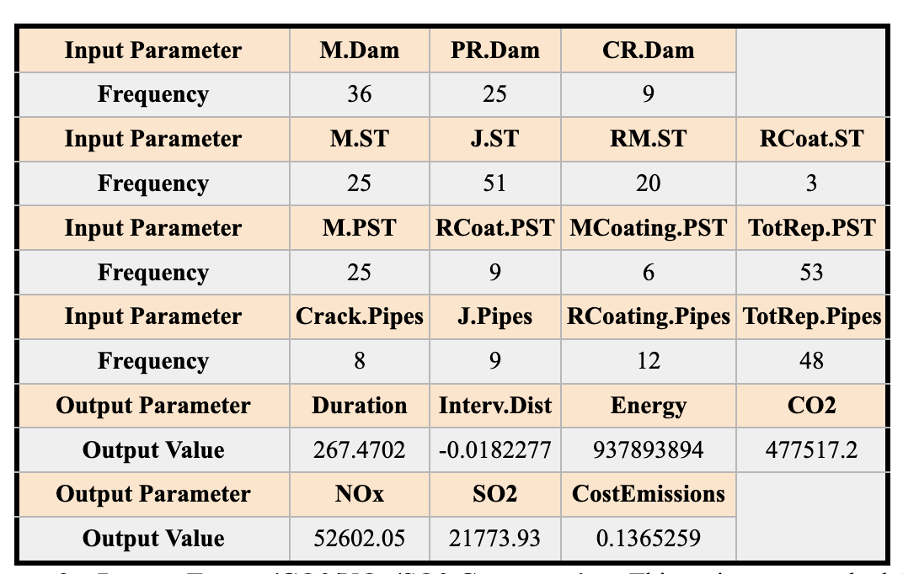
1. Lowest Duration of Interruptions + Frequency Between Distributions:
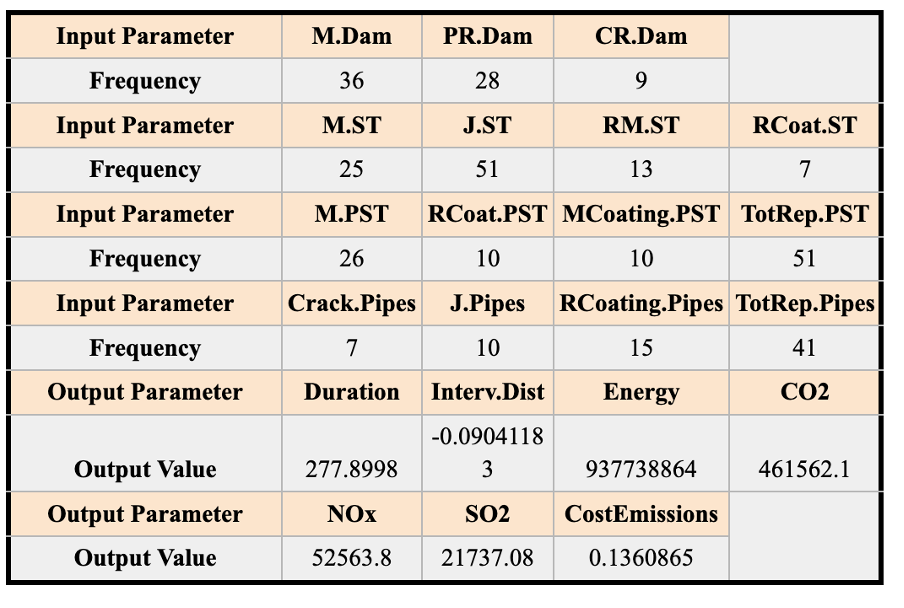
Our group recommends this schedule for when the engineers of a project want to have the lowest overall service downtime. This was found to be the Pareto Front schedule which gave both the lowest duration of interruptions and the lowest frequency of interruptions. This is recommended highly for all applications of the model, but particularly if we want to take into account accessibility and inclusion. As mentioned before, it is extremely annoying for any person to have interruption in their water services, but it would be terrible if this occurred while you are recovering from a medical procedure. At the beginning of the report, the total duration with the basic maintenance schedule was 327 days. Analyzing our result of 267 days after completing the Multi Objective Analysis using the Pareto Front, we can see that our maintenance days have significantly decreased.
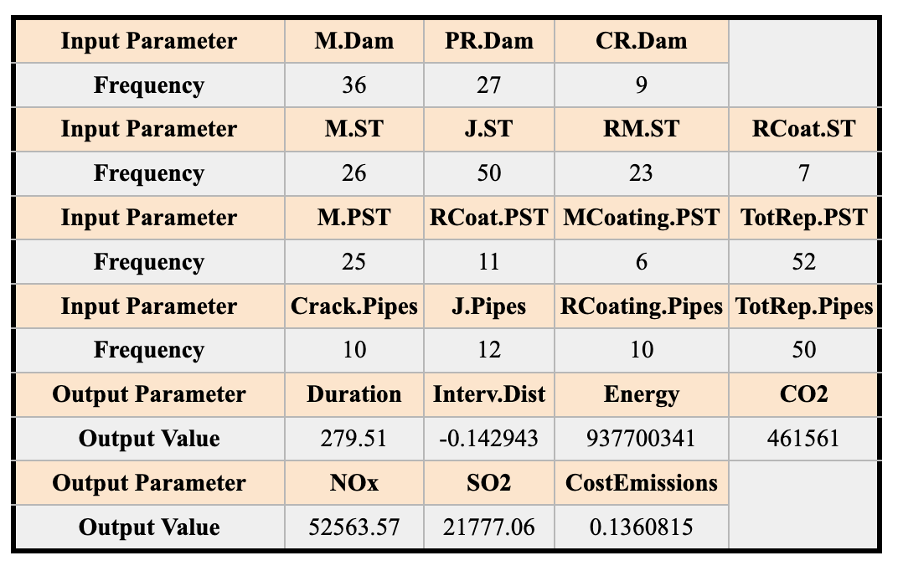
2. Lowest Energy/CO2/NOx/SO2 Consumption:
This maintenance schedule is recommended if a project is looking to be environmentally sustainable above all else. Here, engineers can choose this Pareto Front point to prioritize being environmentally sustainable, despite trade offs of having a longer duration and higher frequency of maintenance. Analyzing the results, we see that the duration and time between interventions has increased from the last maintenance schedule, but the Energy/CO2/NOx/SO2 and Cost from Emissions have all decreased. Again, this is recommended if a project is striving to be as environmentally sustainable as possible and is willing to sacrifice service level with more frequent service interruptions for the customers.
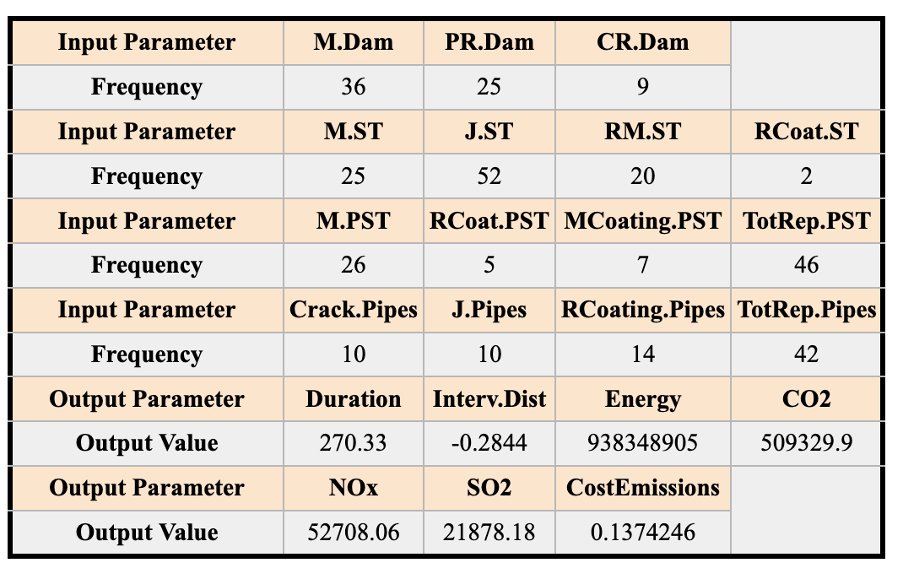
3. Slightly Favoring Intervention Duration/Intervention Frequency Over Emissions:
This maintenance schedule is recommended if the project wants to slightly favor customer satisfaction with the system (less service interruptions and frequency of maintenance), but still wants to take into account emissions while choosing a maintenance situation within the Pareto Front. As we see in these results, the intervention duration/intervention frequency is greater than when lowering duration and frequency was 100% favored within the Pareto Front. Likewise, the emissions are slightly higher than when emissions were 100% favored when choosing from the Pareto Front. Since we are slightly favoring intervention duration and frequency over emissions, the result is closer to Situation 1 where intervention duration/frequency was completely favored.
4. Slightly Favoring Emissions Over Intervention Duration/Intervention Frequency Over:
This maintenance schedule is recommended if the project wants to slightly favor the environment, but still wants to take into account customer satisfaction (low intervention duration/frequency) while choosing a maintenance situation within the Pareto Front. As we see in these results, the intervention duration/intervention frequency is greater than when lowering duration and frequency was 100% favored within the Pareto Front. Likewise, the emissions are slightly higher than when emissions were 100% favored when choosing from the Pareto Front.
Since we are slightly favoring emissions over intervention duration and frequency, the result is closer to Situation 2 where emissions were completely favored.
