Introduction:
The pipeline mixer is highly effective in various applications within water supply, wastewater treatment, and environmental engineering. It facilitates the rapid and efficient mixing of substances such as coagulants, flocculants, ozone, liquid chlorine, and acid-base neutralization in water. This equipment is characterized by its quick and efficient operation, simple structure, energy efficiency, and compact size. Without the need for external power, the flow of water through the pipeline mixer generates three effects: splitting, cross-mixing, and reverse swirling. These effects contribute significantly to improving water treatment efficiency and conserving energy.
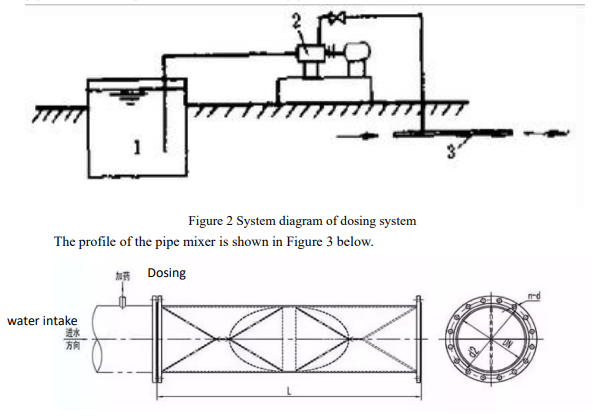
The pipeline mixer is used in the dosing system of wastewater treatment plants, with the aim of rapidly mixing treated water with various chemicals. Its simple system diagram, as shown in Figure 2, consists of a chemical storage section (1), a metering pump (2), and a pipeline (3). The pipeline mixer is typically installed within the pipeline section (3). Next, we will conduct a life-cycle assessment of this system.
Life-Cycle-Analysis
Scope and Boundary conditions:
The primary objective of this analysis is to identify and compare the environmental performance of different design options, with a particular focus on reducing energy consumption.
Through a detailed examination of these aspects, our aim is to provide solid data support and informed design choices for the sustainable development of wastewater treatment plants.
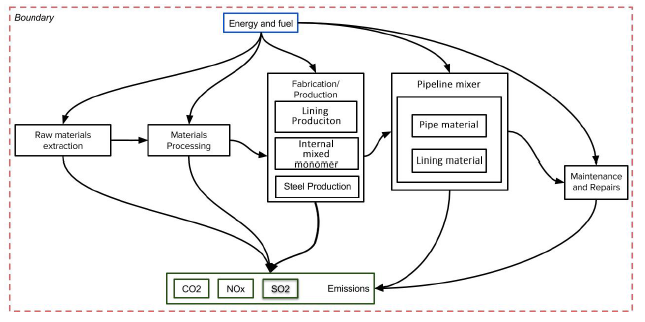
Table 1 Design option
|
Design option |
Pipe material | Pipe lining materials | Internal mixed monomers |
|
Option 1 |
steel | PVC | stainless steel |
| Option 2 | steel | PTFE |
stainless steel |
| Option 3 | stainless steel |
stainless steel |
To complete the evaluation of the pipe mixers, I collected information for each material regarding energy consumption for manufacturing and processing (MJ/t), CO2, NOx, SO2 (kg/kg), and costs associated with extraction, processing, manufacturing, and construction, as shown in Table 3 below.
Table 3 Cost Information Sheet
| Material | Scope | Quantities | Energy(MJ/t) | CO2(kg/kg) | NOx(kg/kg) | SO2(kg/kg) |
| steel | steel | 1 | 2430 | 1.98 | 1.00× 10⁻³ | 1.60× 10⁻³ |
| Stainlesssteel | SS | 1 | 6000 | 4.14 | 6.40× 10⁻³ | 1.03× 10⁻³ |
| PVC | PVC | 1 | 56070 | 1.2 | 3.50× 10⁻³ | 2.90× 10⁻³ |
| PTFE | PTFE | 1 | 45000 | 9.6 | 3.63× 10⁻³ | 1.84× 10⁻³ |
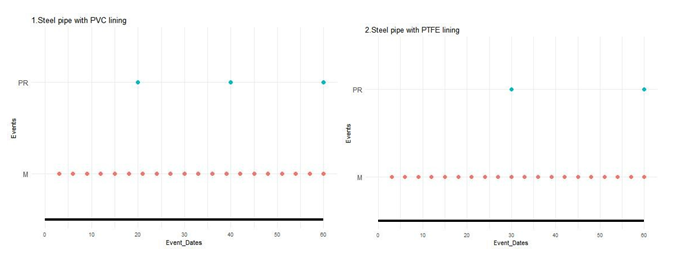
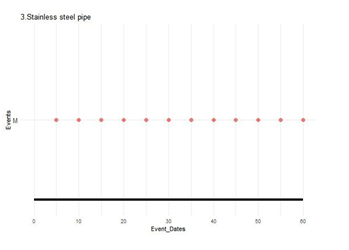
For each design option, the intervention period is based on engineering experience as well as online design parameters, the timeline plots for the three design options can be obtained through the Shiny program.
This study integrates data from a variety of sources. While these different sources of data enrich the analysis by providing multiple perspectives and a wide range of information, it is important to recognize that this diversity also introduces variations in the accuracy and reliability of the data. Due to the nature of the data sources, a degree of uncertainty remains in this study.
Results of the Life-Cycle Analysis:
A life cycle analysis was conducted using the R language to examine the energy consumption, CO2 emissions, NOx emissions and SO2 emissions of the three different design scenarios.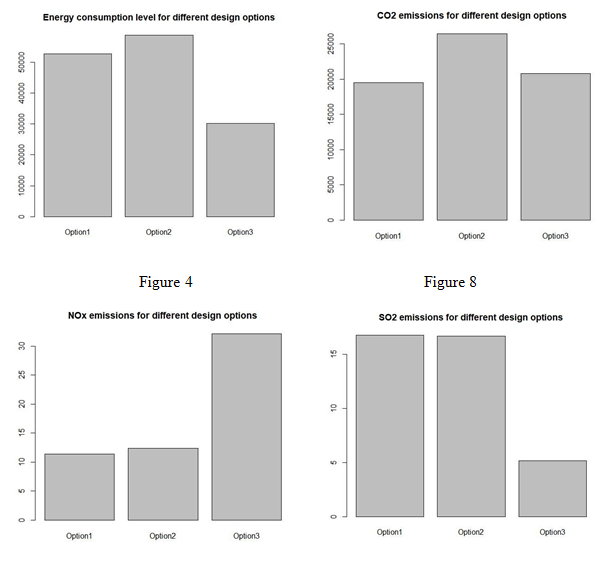
The results show that Option1 has a balanced performance in terms of energy consumption and CO2 emission, with relatively low energy consumption but not optimal CO2 emission, Option2 has the worst performance in terms of energy consumption and CO2 emission, but relatively low NOx emission, and Option3 has the best performance among all the indexes, especially in SO2 emission, which is much lower than the other two options. A multi-criteria decision analysis is still needed to determine which design option to ultimately adopt.
Conclusion:
this study provides robust data support and theoretical guidance for the design of wastewater treatment plant pipeline mixers. It underscores the importance of striking a balance between environmental sustainability and efficiency, offering valuable lessons for decision-making in similar future projects. By comprehensively considering multiple critical factors, we can better achieve the sustainable development of engineering systems and environmental protection.
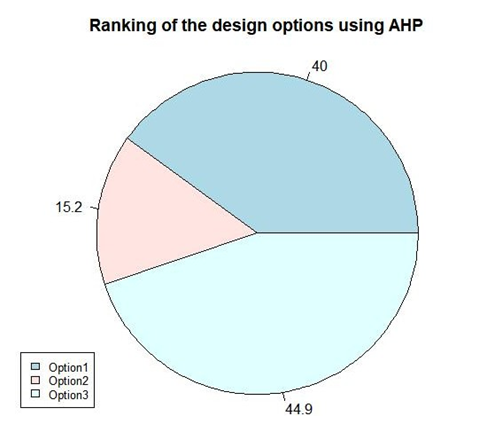
As can be seen, Option 3, has the highest percentage of 44.9%, while Option1 is only 4.9% different from it, and Option2 is less suitable in comparison with only 15.2%. Thanks to the low energy consumption and CO2 emissions of stainless steel during its life cycle, Option3 is the most suitable option in this study. However, it is worth mentioning that stainless steel has high NOx emissions during its life cycle, which is not a priority in this evaluation, but needs to be taken into account in practical applications, and the cost of stainless steel is more expensive than carbon steel, which needs to be taken into account in practical engineering applications.
References:
- World Stainless (2023) Stainless Steels and CO2: Industry Emissions and Related Available at:
https://www.worldstainless.org/about-stainless/environment/stainless-steels-and-co2-industry-emi ssions-and-related-data/ (Accessed: 13.01.2024).
- Brighter Strings (2016) Stainless Steel Energy Use. Available at: https://brighterstrings.wordpress.com/2016/03/27/stainless-steel-energy-use/ (Accessed: 01.2024).
- Itsubo, and Inaba, A. (2003) ‘Assessment of Environmental Impact of Manufacturing Steel Considering Physical Damage to Human Health’, Materials Transactions, 44(1), pp. 167-172. Available at: https://www.jstage.jst.go.jp/article/matertrans/44/1/44_1_167/_article (Accessed: 13.01.2024).
- Inference (2023) Eco-profiles of the European Plastics Available at: http://www.inference.org.uk/sustainable/LCA/elcd/external_docs/bpvc_31116f08-fabd-11da-974d- 0800200c9a66.pdf (Accessed: 13.01.2024).
- Alsadi, A. and Matthews, J.C. (2022) ‘Reduction of Carbon Emission Is Optimized During the Life Cycle of Commonly Used Force Main Pipe Materials’, Frontiers in Water, Available at: https://www.frontiersin.org/journals/water/articles/10.3389/frwa.2022.735519/full (Accessed: 13.01.2024).