Introduction
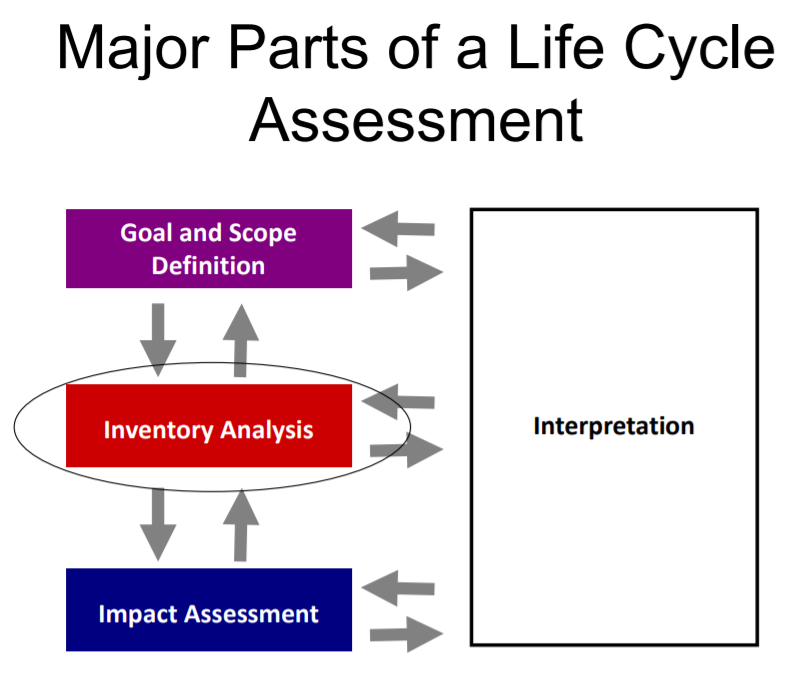
A life-cycle inventory is a process of quantifying energy and raw material requirements, atmospheric emissions, waterborne emissions, solid wastes, and other releases for the entire life cycle of a product, process, or activity. An inventory analysis produces a list containing the quantities of pollutants released to the environment (after treatment or control) and the amount of energy and material consumed. The results can be segregated by life-cycle stage, media (air, water, and land), specific processes, or any combination thereof [1].
“LCI” quantifies the total environmental loads generated within life cycle stages defined in the goal and scope definition. The procedure to collect inventory data starts on the basis of the data requirement for each life cycle stage, especially which type of data is needed for the stage: foreground or background data.
A product’s life cycle starts when raw materials are extracted from the earth, followed by manufacturing, transport and use, and ends with waste management including recycling and final disposal. At every stage of the life cycle there are emissions and consumption of resources. The environmental impacts from the entire life cycle of products and services need to be addressed. To do this, life cycle thinking is required [2].
Scope and Goal
The main goal of the analysis has been to explore environmental impact of the most common measures for tunnel followed by bridge. With concrete and steel being the main construction materials, the environmental impact is expected to be relatively high. In difficult ground conditions, the support system is also in need of frequent maintenance works. The material consumption related to maintenance has been included here, so that the final output represent the total environmental burden over its designed lifespan.
Life Cycle Time Span
This function will take as inputs the following:
- Lifetime – lifetime we assumed for out civil system – 100 years
- events – is a vector of interventions including the frequency of each intervention. As an example, this vector for the first design option is defined as events.Op1 = c(SDO = 15, M = 5, DR = 30, END = lifetime), where,
M – is the maintenance performed every 5 years and DR is deck replacement performed every 30 years.
and, events.Op2 = c(BR = 17, M.r = 6, AACL = 15, END = lifetime), where, AACL is Apply Anti-corrosion Layer, which means applying anti-corrosion coating every 15 years.
- Date represent the start date of the lifecycle- 2020-01-01
- Name – is the name of the design option:
- Option 1 Cast in place deck and steel girders
- Option 2 Tunnel
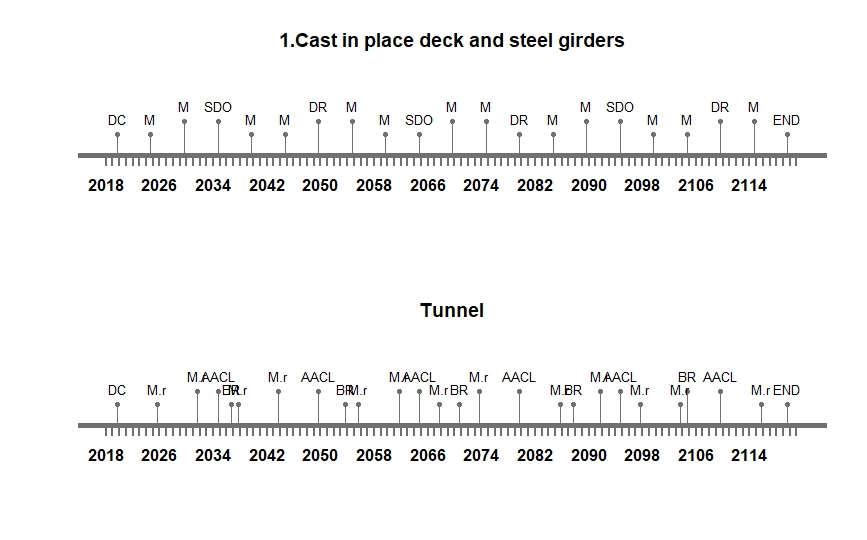
Here, in the above figure we can see the 2 design options where the materials are different too, and it has a great impact on the tunnel and bridge life cycle timeline, like if we say for the design option 1, if we do proper maintenance every 5years, the bridge will be fine up till its end lifetime. Then for design option 2, with every 15 years of maintenance for the anti corrosion coating, the bolts need to be replaced after every 17 years and the mesh repairing should be done every 6 years as per the research for the tunnel lifetime.
Life Cycle Inventory and Analysis
Materials have been chosen according to the background research for tunnel and bridge types and girders, and the materials used for them. The material specifications and the environmental indicators for them will be found here.
All the materials and the emissions from them are effecting the environment in different ways. As for the material we have decided to have the outcome in environmental impact as below:
- Energy Emission
- CO2-Emission
- SO2-Emission
- NOx-Emission
- Cost impact on the environment : Energy.costs <- 0.128
CO2.unitcost <- 26 # per metric tone
NOx.unitCost <- 42 # per metric tone
SO2.unitCosts <- 85 # per metric tone
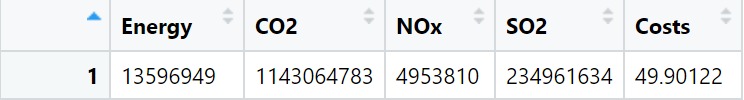
The emissions are shown in the graph below,
Here is the clear data where we can see the cost with the percentage of emission of CO2, SO2 and NOx,
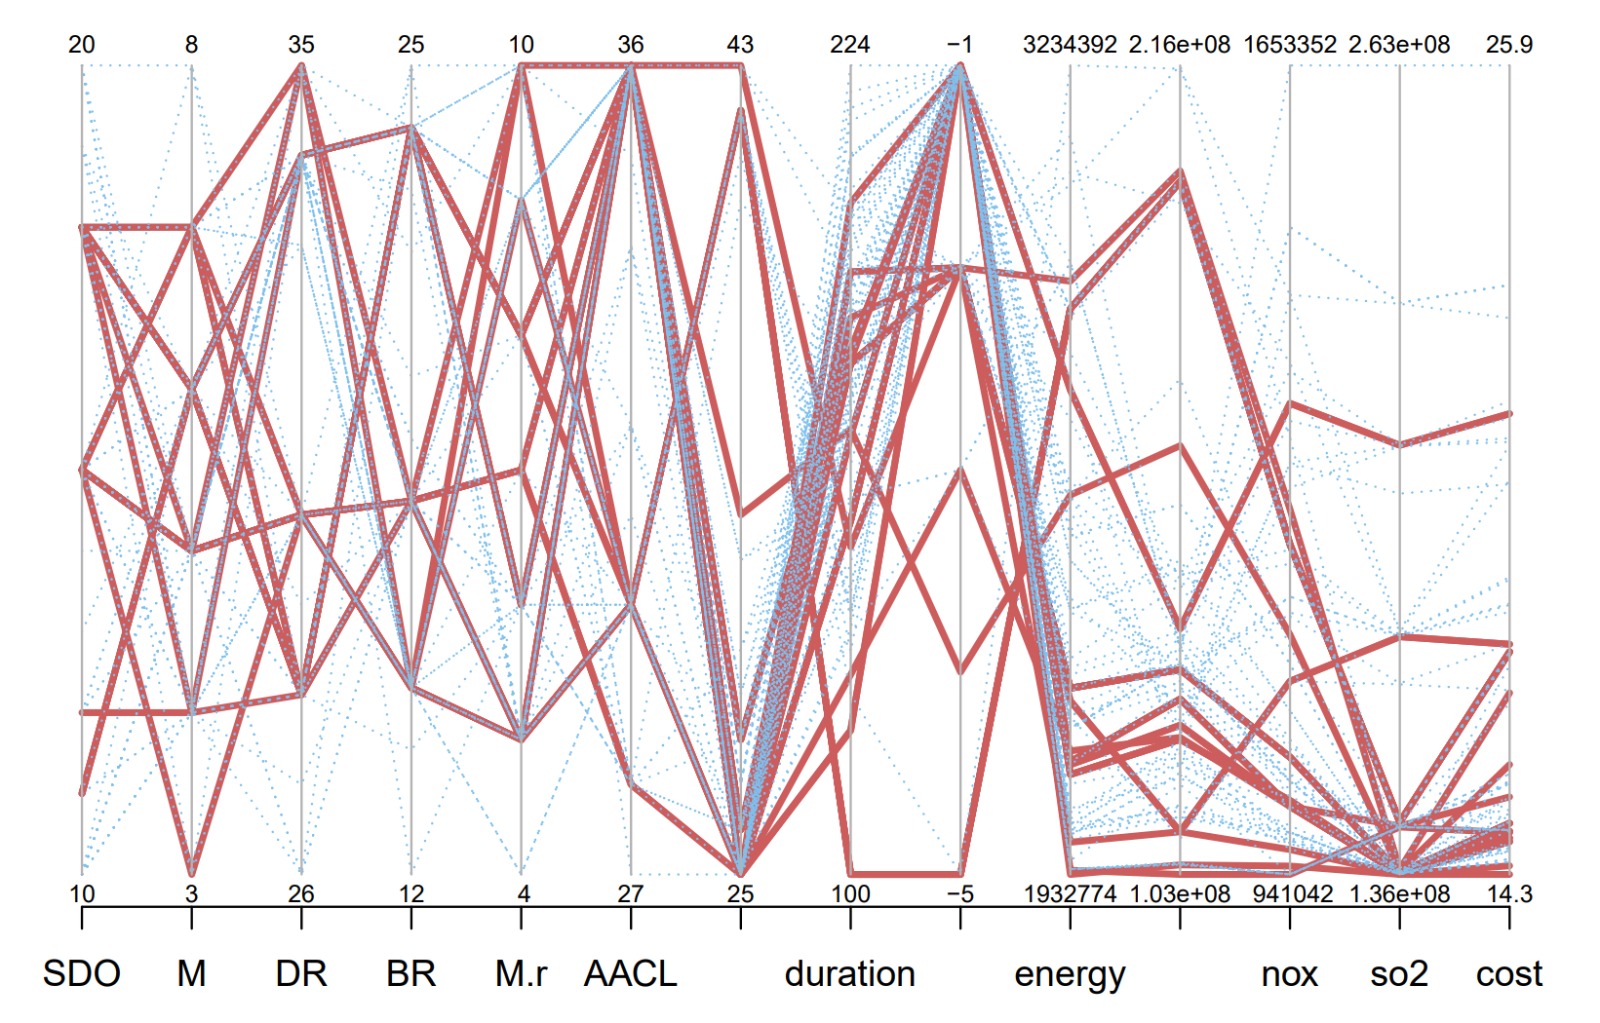
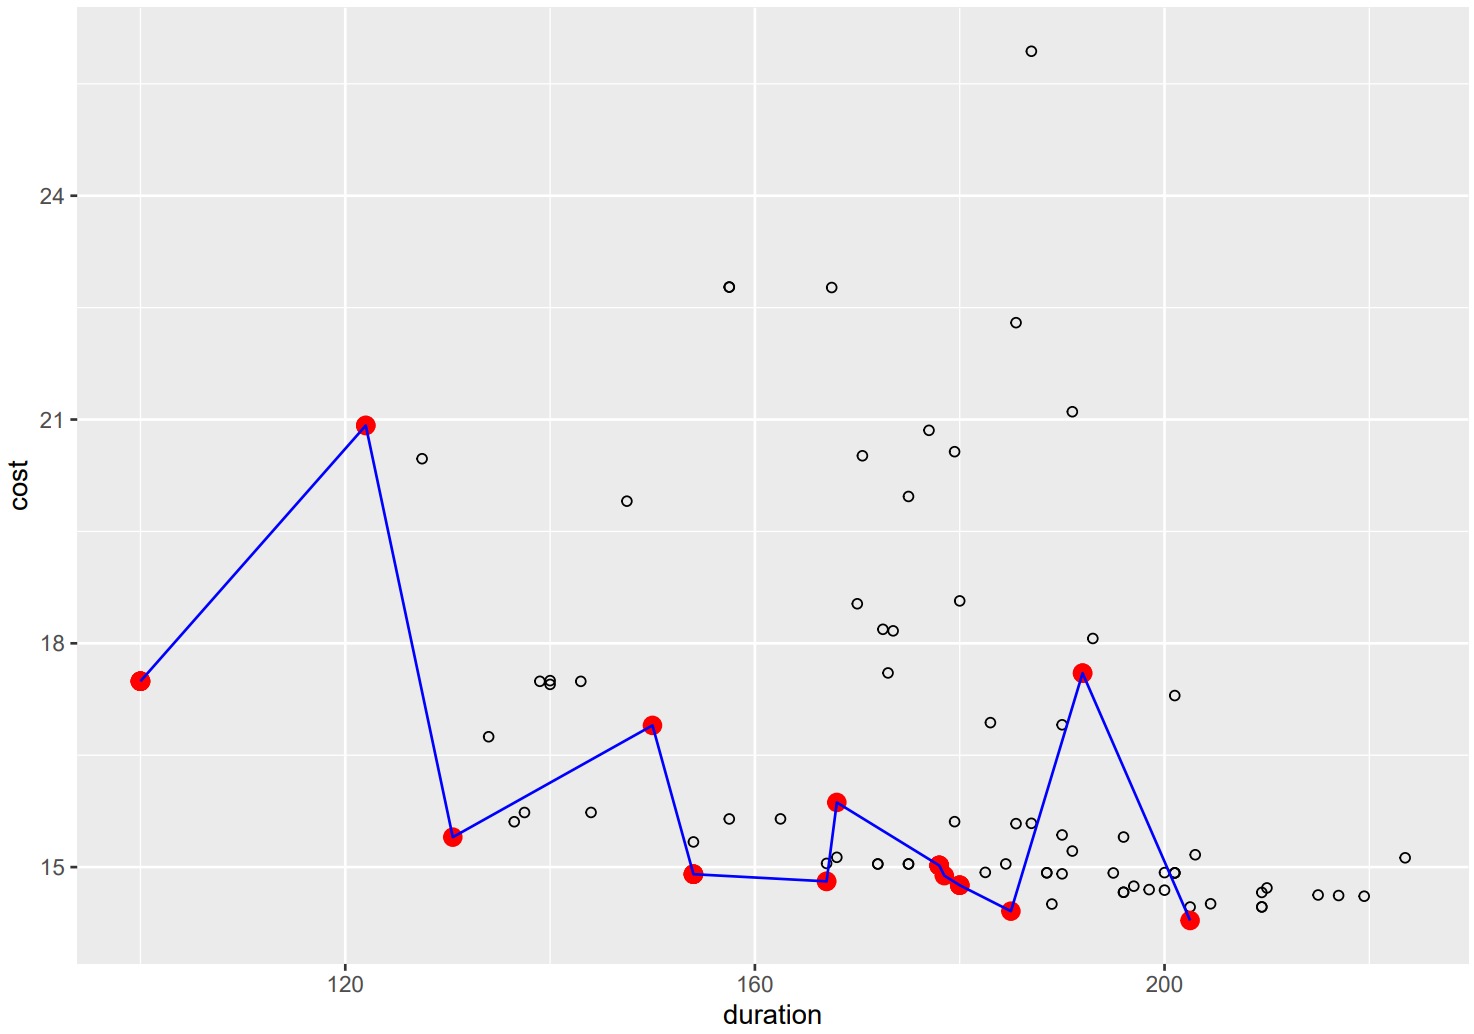
With time being the materials energy emission and the cost cycle turn to be like the below graph for the life span of 100 years,
In engineering practice, builders and maintenance personnel can use this as a reference and will seriously improve the way tunnel and bridge are designed and maintained in the future. In Life Cycle Inventory and Analysis, we can see our optimal solution through graphs, but there are always errors in the compilation of data, and the debugging process is complicated. I think this is also a problem of using the model to analyze LCA. After all, with the complexity of the code framework, it is difficult for general engineering to deal with the problems encountered.
REFERENCES
[1] https://www.sciencedirect.com/topics/agricultural-and-biological-sciences/life-cycle-inventory.
[2] https://www.researchgate.net/publication/252225470_Life_Cycle_Inventory_Analysis_LCIA