Introduction
There are millions of Rail Bridge over the world. These bridges are made at different times with different materials. Furthermore, they are subjected to different magnitudes, frequencies and distribution of rail load and are exposed to variable environmental conditions. Without having a systematic approach for decision making, managing these has become a real challenge for engineers. It is important to assess the life-cycle impact and efforts associated with a specific design decision already during the design phase. Decisions taken during the design phase impact the whole life cycle of civil engineered systems. Provided that these civil systems are designed for a long lifetime, maintenance plays an important role.
Railway Bridge Sub-systems
The main sub systems of a Railway Bridge are the sub-structure and the super-structure. The substructure consists of the foundation for the structure, which can be a pile foundation or different kinds of footing foundation depending on the soil and load conditions. Apart from that it contains Pier, Abutment, Wing and Return Walls. The super-structure consists of Bearing, Deck, Primary and Secondary Superstructures, Arch and Railway Line components.
Defining Goal and Scope
For the completion of the assessment, we have chosen one of the super structure as the sub system. But in order to make the project a unique one, the analysis is conducted on the some structural components of the super structure of the railway bridge i.e deck and girder. The main aim for building a Railway Bridge is for the purpose of transportation that includes human as well as goods. It has a lot of design aspects, so it will be better for us to understand the life cycle assessment part for the railway bridge.
Goal and Scope
The goal of this project is to find out the carbon footprint of the framed structure. Fig.1 defines the scope and boundaries of this project. This scope is defined to make design engineers to decide on the energy and emission factors for each materials used in designing of railway sleepers and other components. After the completion of the assessment, you will be able to find the answers for the question how to assess the life-cycle impact of different design options, how to use different multi-criteria decision making methods to support an informed decision making process.
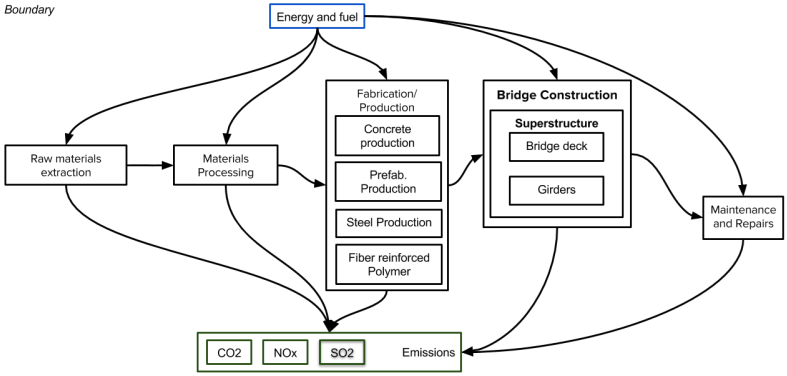
Fig. 1: Scope and Boundary definition for Life Cycle Analysis
For the analysis of the chosen system, we have three different design options. Table 1 give us a brief description of the design options.
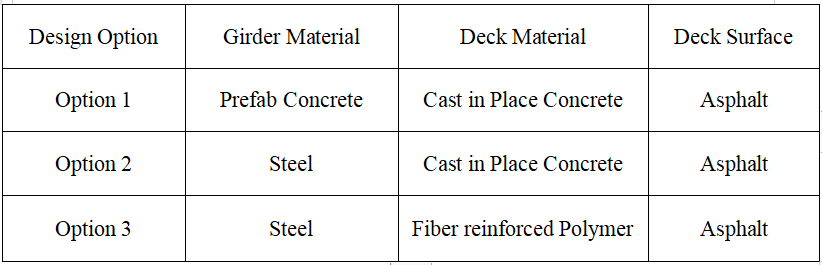
Table1. Design Options
The table below present the materials used in this tutorial for different elements under analysis.
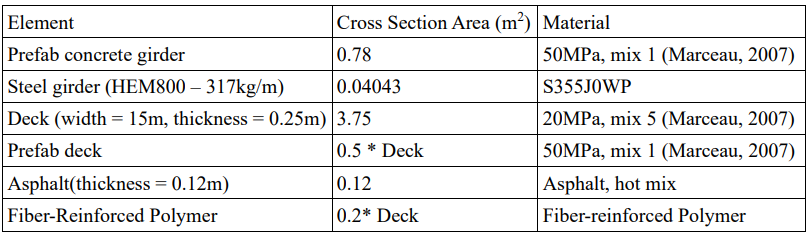
Table2. Materials used
Life Cycle Inventory
The composition for different materials used in this project is represented in the table shown below. The table contains the information regarding the energy consumption, CO2, NOX and SO2
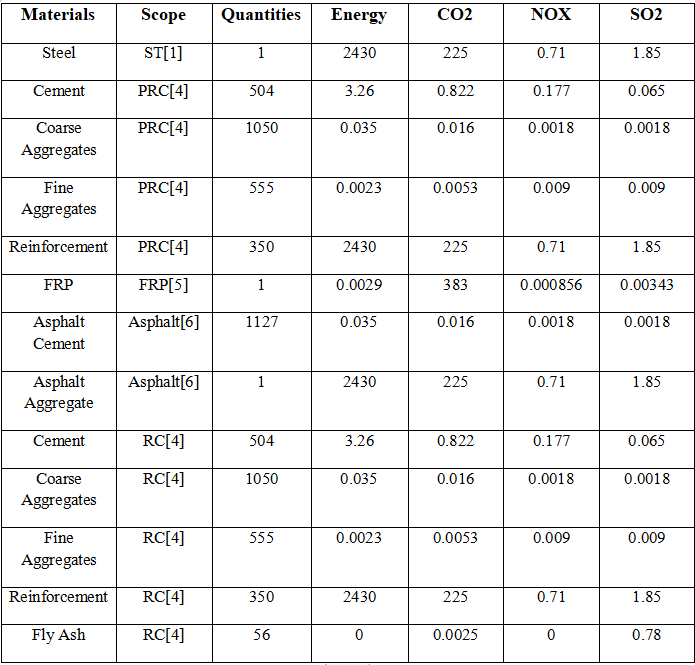
Table3. Material Composition
The scope column indicates the use of a specific material in the composition of a specific mix, such as RC = reinforced concrete, PRC = pre-stressed reinforced concrete, FRP = fiber reinforced polymer. For each material, we collected information about energy consumption for fabrication and processing, CO2, NOx, SO2. The energy for each material is in MJ/t. The quantities column has a different meaning, depending on the materials. For PRC those are the quantities of materials consumed to produce a cubic meter of concrete, respectively the reinforcement in Kg usually used for 1cubic meter of concrete.
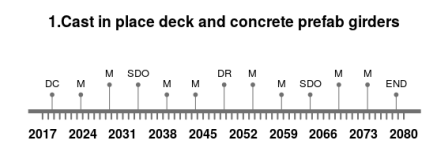
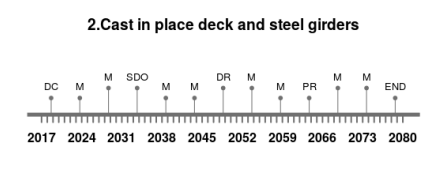
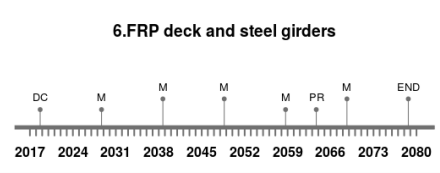
Life Cycle Timeline
For the construction of the timeline we will use the following maintenance interventions as given below
Option 1 – SR = 15, M = 5, PR = 30, END = lifetime
Option 2 – SR = 15, M = 5, PR = 30, PR = 45, END = lifetime
Option 3 – M = 10, PR=30, END = lifetime
Here PR – Permanent Replacement, DR – Deck Replacement and M – Maintenance.
We have assigned 01-01-2023 as the start date of the construction and the start point is defined as BC – Bridge Construction. The lifespan of the system is 100 years. The generated timeline for the Options are shown below.
Life Cycle Inventory Analysis
After generating a set of plots as shown above, we are ready to start with the life cycle inventory and the results of the same are as following:-
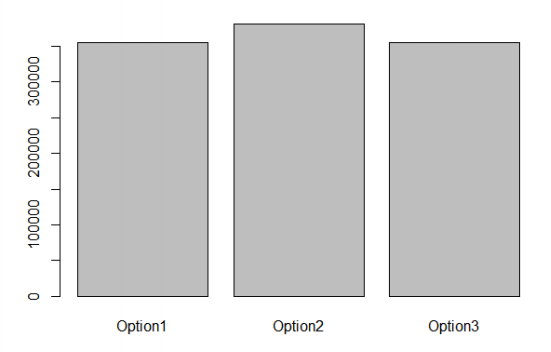
Fig2. Energy Consumption for different design options
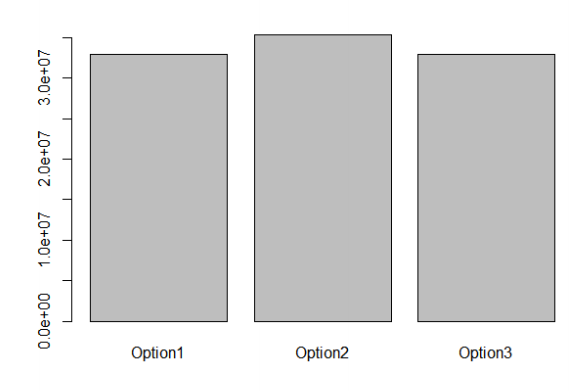
Fig3. CO2 Emission for different design options
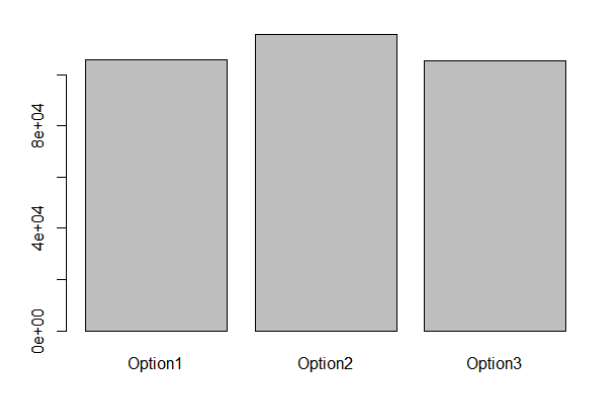
Fig4. NOx emission for different design options
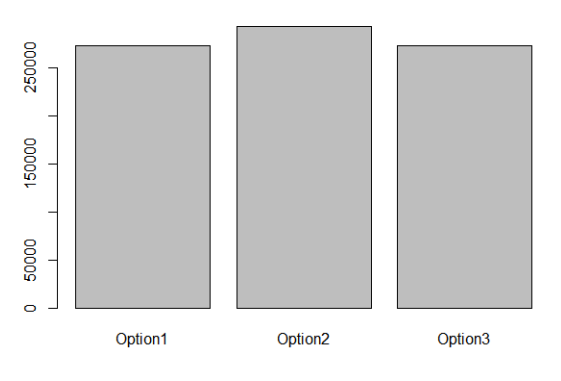
Fig5. SO2 emission for different design options
Alternatively, we can create radar plot to have an overview of all indicators and is as follows
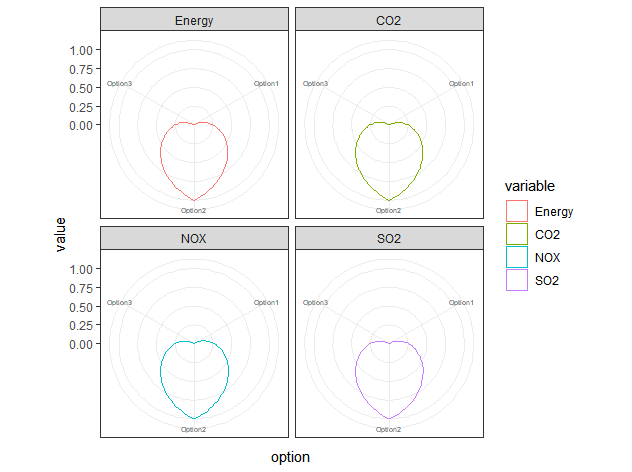
Fig6. Radar plot for the different indicators
MCDA – TOPSIS
For this model let’s conduct the TOPSIS method to analyze the system. TOPSIS is a simple ranking method in conception and application. The standard TOPSIS method attempts to choose alternatives that simultaneously have the shortest distance from the positive ideal solution and the farthest distance from the negative-ideal solution. The positive ideal solution maximizes the benefit criteria and minimizes the cost criteria, whereas the negative ideal solution maximizes the cost criteria and minimizes the benefit criteria. [7]
Let’s define the weights for each indicator as follows
Energy – 35%, CO2 – 25%, NOx – 25%, SO2 – 15%
For TOPSIS 1st method we decide the criteria to be minimum for all the indicators.
TOPSIS 2nd method works on comparison to ideal solution. For this, we will define the scores
for positive and negative solution.
Positive ideal solution – Energy – 0.11, CO2 – 0.12, NOx – 0.15, SO2 – 0.05
Negative ideal solution – Energy – 0.5, CO2 – 0.75, NOx – 0.5, SO2 – 0.85
After conducting the TOPSIS analysis the resulting rankings are shown in Fig. 7 and Fig. 8
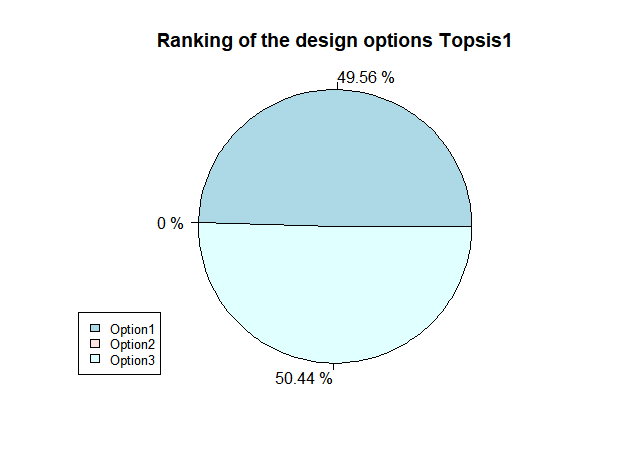
Fig7. Ranking of Design Option TOPSIS 1
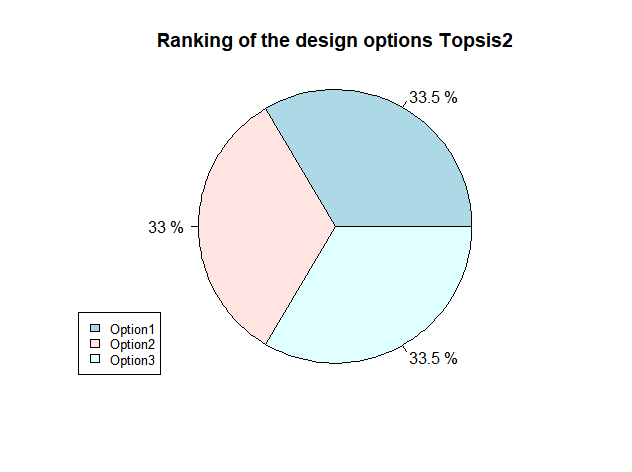
Fig8. Ranking of Design Option TOPSIS 2
After all the different analysis done for the railway line sub system, we can see that all the analysis indicates that Option 3 and Option 1 i.e FRP deck with Steel Girders and Cast in place deck and concrete prefab girders are the best option for the super structure of the railway bridge. But the overall analysis says that FRP deck with Steel Girders has an upper hand over the rest . In life cycle inventory analysis for all the different energy and emission criteria timber had the least emission and energy requirements, even the TOPSIS ranking was also in favour for FRP deck with Steel Girders. A design engineer can use these analyses to decide on the Option for the construction of a Railway Bridge.
References
- Askarinejad, H., Zeng, J., Ferdous, W., 2022, A Comparative Analysis of Timber and Composite Sleepers.
- Australian Rail Track Corporation Limited., Engineering (Track & Civil) Standard ETA-02-03 Steel Sleeper Specification.
- Dan Li et al., 2017, Influence of vertical holes on creep and shrinkage of railway pre-stressed concrete sleepers.
- Kaewunreun, S., Remennilov, A., 2016, Modelling Railway Pre-stressed Concrete Sleepers (Crossties) With Holes and Web Openings.
- Gopalakrishnan, A. Mate, Y. Mardikar, D.P. Gupta, R.W. Plummer., 2005, Energy Efficiency Measures in the Wood Manufacturing Industry.
- Roberto Sañudo, Marina Miranda, Borja Alonso, Valeri Markine., 2022, Sleepers Spacing Analysis in Railway Track Infrastructure.
- Majid Behzadian, S. Khanmohammadi Otaghsara, Morteza Yazdani and Joshua Ignatius (2012). “A state-of the-art survey of TOPSIS applications.” Expert Systems with Applications, Volume 39.