In the life cycle assessment (LCA) of complex civil engineering projects encompassing multiple subsystems, Multi-Objective Optimization plays a pivotal role in identifying an optimal set of design solutions that effectively balance various objectives to maximize overall benefits. Factors considered in this project include the reduction of CO2, SO2, and NOx emissions, cost consumption, energy consumption, total maintenance intervention time, and the minimum distance between two consecutive interventions.
To comprehensively address these factors, we employ a multi-objective genetic algorithm (NSGA-II) to generate a solution set by optimizing a Fitness function (Figure. 1), which is then evaluated using the Pareto Frontier analysis method. Through this iterative process, NSGA-II gradually refines individuals to approximate the Pareto Frontier, ultimately yielding a set of non-inferior solutions closely aligned with this frontier. These solutions, representing an optimal solution scope, exhibit no clear advantage across each target indicator.
The multi-objective genetic algorithm and Pareto Frontier analysis method are integral to the LCA analysis of civil engineering projects, particularly in striking a balance among various factors such as minimizing intervention impact time, maximizing time between consecutive interventions, reducing emissions (CO2, SO2, NOx), and curtailing cost and energy consumption. By systematically searching and evaluating non-inferior solution sets, engineers can navigate trade-offs among multiple feasible design options, thereby offering comprehensive decision support to achieve more sustainable and cost-effective project designs.
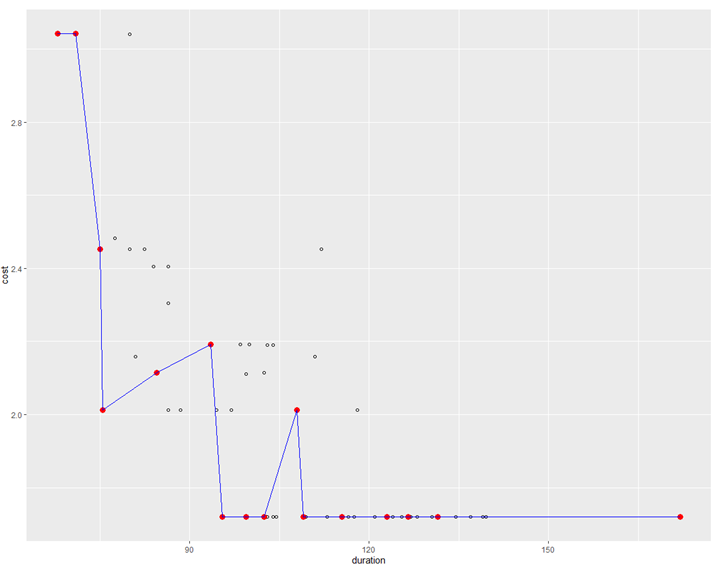
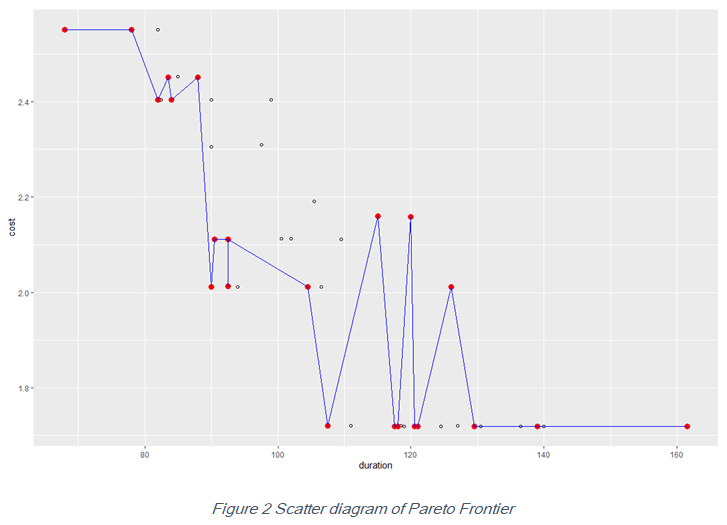
Through optimization using NSGA-II, Figure 2 depicts the results obtained, with the abscissa representing duration and the ordinate representing cost. In the figure, the red dot indicates the Pareto value, while the blue line represents the Pareto Frontier. Variations in the number of generation and the size of Popsize led to two distinct Pareto Frontier outcomes, highlighting the significant influence of the generation count on Popsize within this method.
The configuration of these parameters dictates the overall operational scale of the algorithm, impacting scenario diversity and the number of algorithms runs, consequently affecting the quality of the Pareto solution. Increasing the number of generations typically extends the algorithm’s runtime but may enhance the likelihood of identifying a Pareto optimal solution, particularly in complex problems with high target diversity. Conversely, an excessively large Popsize may escalate the computational burden, while a small population size could result in the algorithm being trapped in a local optimum or lacking sufficient coverage of the search space.
Hence, optimizing the final solution’s performance involves adjusting these parameters, followed by comparing and analyzing the results to inform further refinements. Based on the results below, several options stand out for their advantages in terms of low duration or cost.
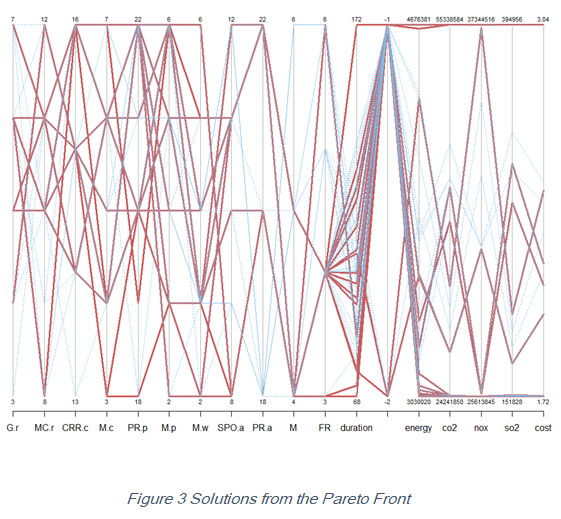
Finally, we analyze the impact of initial value setting on project operation results through accumulated value parameters by adding all the criteria (such as duration, energy consumption, emissions and cost). As shown in Figure 3 below, the red lines represent the Pareto optimal solutions which strike an optimal balance between multiple goals, and no one solution is better at all goals, while the blue lines represent non-optimal solutions. This graph is used to show the relationship between multiple variables at the same time. This graph is used to show the relationship between multiple variables at the same time. In a parallel coordinate plot, each line represents a scenario and each vertical axis represents a variable. This provides a visual representation of which solutions are optimal under multiple metrics.
Overall, it can be seen from the results of the graph that some options consume more energy or have a longer maintenance impact duration than others. Therefore, the choice of solution may vary depending on the needs and goals of the stakeholders or designers.


