INTRODUCTION
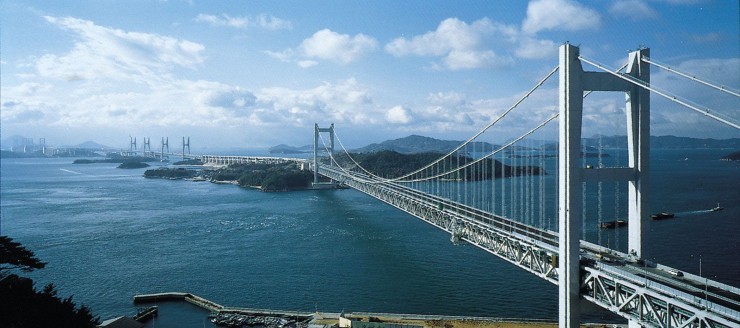
Bridges symbolize one of the most vital infrastructure mechanisms within the transportation network, as they have a prospective effect on everyday lives of the traveling public. The bridges and viaducts on major infrastructure projects have a high intensity of carbon compared to the average per kilometer [1]. Sustainability, climate change issues and carbon emissions have recently turned out to be more prominent. To regulate carbon emissions and reduce them we need to recognize where and how much we use [2]. Engineers have regularly maintained trajectory of material quantities to assess cost; the carbon substance of a bridge can be computed from the basic material quantities and construction methods.
Larsson Ivanov et al. [4] have investigated air pollution and greenhouse gas emissions from the production of certain infrastructure materials and products. They demonstrated that road transport is also a major source of greenhouse gas emissions. The Swedish Transport Authority has planned that the investment of infrastructure projects (such as bridges and tunnels) would increase by at least 5 billion Euros from 2020 to 2029, and that carbon dioxide emissions must be cut by between 17% to 30% [3].
SCOPE
Due to the swift evolution of the construction industry’s global conservational impact, especially the environmental effect contribution of bridge structures, it is necessary to study the detailed environmental influence of bridges at each stage of the full life cycle, which can offer optimal data support for sustainable development analysis. Bridges are assets that with good design can help to reduce the carbon emissions of a project. In this project assignment the embodied carbon of the structures is presented that the carbon content is heavily influenced by the material specification as well as a little amount of SO2. Hence, decision can be taken while designing the bridge focusing on the factors effecting the carbon emission and its footprint.
LIFE-CYCLE TIMELINE
This function will take as inputs the following:
• Lifetime – lifetime we assumed for out civil system – 100 years
• events – is a vector of interventions including the frequency of each intervention. As an example, this vector for the first design option is defined as events.Op1 = c(SDO = 15, M = 5, DR = 30, END = lifetime), where,
M – is the maintenance performed every 5 years and DR is deck replacement performed every 30 years.
• start.Date represent the start date of the lifecycle- 2020-01-01
• option.Name – is the name of the design option:
1. Option 1 Cast in place deck and steel girders
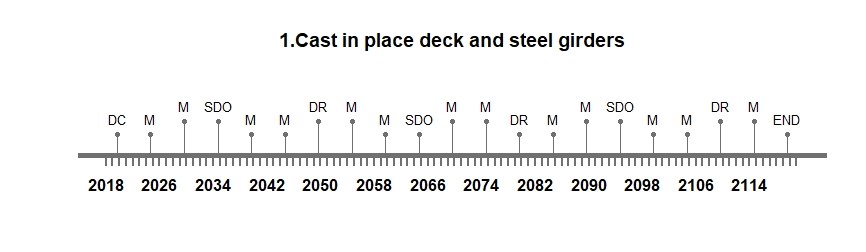
For the life cycle schedule of civil products, we can intuitively see the objects we need to maintain and focus on. In particular, it helps maintenance personnel to save a lot of unnecessary maintenance time, which can be operated through the timeline.
REFERENCES
[1] The Carbon Footprint of Bridges, David Collings, Dr, Technical Director, ARCADIS, Guildford, Surrey, UK.
[2] The Intergovernmental Panel on Climate Change. [(accessed on 23 May 2020)]; Available online: https://www.ipcc.ch/2018/10/08/summary-for-policymakers-of-ipcc-special-report-on-global-warming-of-1-5c-approved-by-governments/
[3] Bridge Carbon Emissions and Driving Factors Based on a Life-Cycle Assessment Case Study: Cable-Stayed Bridge over Hun He River in Liaoning, China, ZhiWu Zhou, Julián Alcalá, and Víctor Yepes.
[4] Larsson Ivanov O., Honfi D., Santandrea F., Stripple H. Consideration of uncertainties in LCA for infrastructure using probabilistic methods. Struct. Infrastruct. Eng. 2019;15:711–724. doi: 10.1080/15732479.2019.1572200. [CrossRef] [Google Scholar]