1. Introduction
Continuing the life cycle analysis on my system of interest, a multi-purpose building, during this assignment I am going to conduct a comprehensive life cycle assessment concerning the environmental aspects of the civil engineering system. Essentially, a civil engineering product can undergo life cycle analysis from multiple perspectives, including construction and maintenance costs or energy consumption. However, in this project, the primary focus is on scrutinizing environmental impacts, which are undoubtedly pivotal factors that must be taken into account during the design of every civil engineering product. (The references are given in the Full Report at the end of the page.)
2. Goal and Scope
This work primarily focuses on the detrimental environmental impacts of a multipurpose building. However, the specific objective of this task is to undertake a thorough carbon footprint analysis. Given the intricate nature of building systems comprising multiple subsystems and components, conducting a detailed and comprehensive carbon footprint analysis demands a considerable investment of time and information. Consequently, I decided to concentrate solely on a major subsystem rather than attempting an analysis of all subsystems. To achieve this, I chose External Walls as the focal subsystem for scrutinizing its carbon footprint. The scope and the boundaries of the assessment are presented in Figure 1.
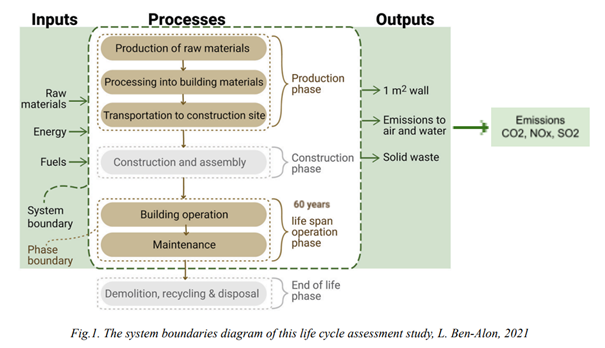
As it can be seen from the Figure.1, the system boundaries considered extraction and processing of raw materials, manufacture of building materials, transportation to the construction site, and maintenance for a 60-year lifespan of the building. Onsite construction as well as demolition and disposal energy and emissions are beyond the system. Essentially, the amount of energy, fuel, and emissions will be calculated for a 1 m2 of external walls. The scope of this study encompasses deciding on the external walls (EWs) of buildings with a maximum height of three stories, catering to a variety of functions, including residential, educational, commercial spaces, and offices.
3. Design Options
To make informed decisions on diverse design alternatives, I conducted extensive background research, specifically delving into various configurations for external walls and their corresponding life cycle inventories (LCI). Drawing substantial inspiration from the study conducted by L. Ben-Alon in 2021, I opted to conduct a comparative analysis between two distinctly different material categories: earthen and bio-based materials on one hand, and conventional materials used in configuring the building’s external walls on the other.
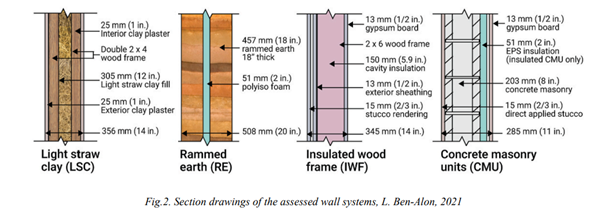
I will perform the comparison between two natural building assemblies (light straw clay and insulated rammed earth) to conventional building assemblies (insulated wood frame, and insulated concrete masonry units). Figure. 2, illustrates all four types of wall configurations analyzing in this study.
4. Life Cycle Inventory
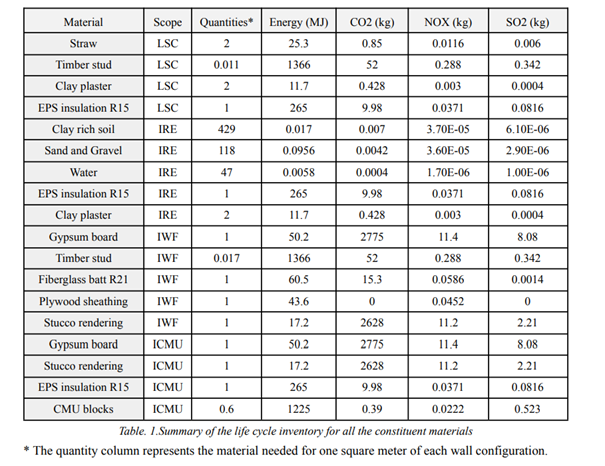
Table 1 provides a summary of the life cycle inventory for all the materials in the design alternatives, along with the calculated quantities of material required to create and construct one square meter of wall. The units of energy and emissions are MJ and kg, respectively. These values are calculated for each material based on their respective units.
5. Life Cycle Timeline
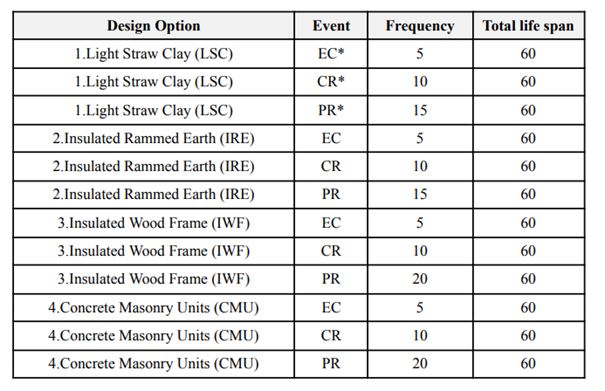
As mentioned earlier, this study also considers the environmental impacts of the system throughout its service life, including the effects of maintenance interventions. To perform this, I conducted an extensive literature review. In the life cycle assessment of natural vs conventional building assemblies, L. Ben-Alon makes suggestions for necessary maintenance interventions for both natural and conventional external wall configurations based on references. These recommendations aim to maintain the functionality of building walls until the end of their life span.
A summary of the considered maintenance interventions is provided in Table 2.
6. Life Cycle Analysis
6.1 Energy
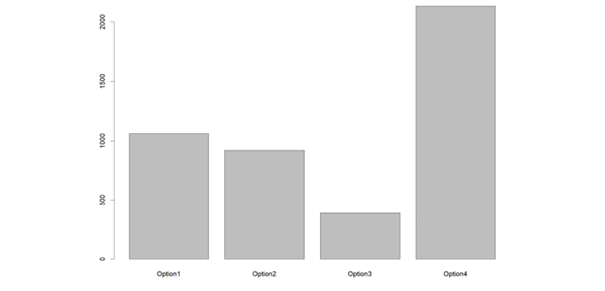
Figures 10-14 illustrate the amount of energy and emissions individually. As it can be seen from the Figure. 3, design option 4 which is our concrete based design option with more than 2000 MJ per one square meter has the highest amount of energy. Surprisingly, light straw and rammed earth walls, which are our bio-based design option, ranks second and three, respectively, in the energy section even though they used only natural and earthen materials. Meantime, wood frame wall design with approximately 400 MJ has the best performance in this section and among the design options.
6.2 Emissions, CO2, NOx, and SO2
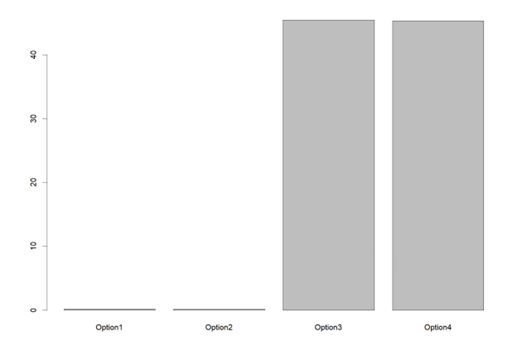
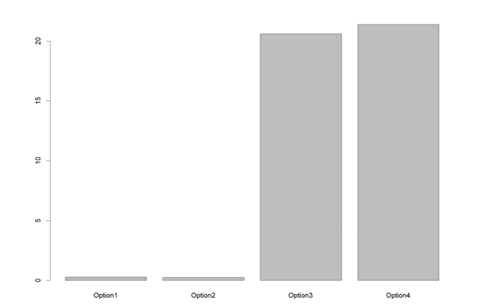
Unlike energy usage, the emissions are significantly higher for conventional design options, as evident in Figures 4, 5, and 6. While the emissions for the two natural design options are close to zero, both conventional options exhibit relatively higher values.
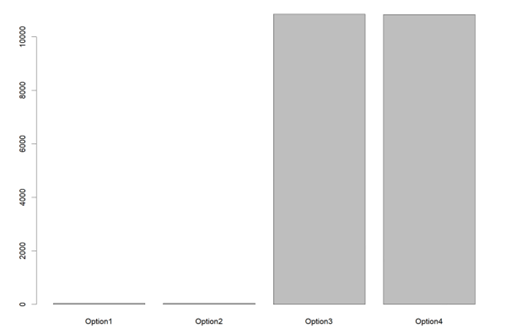
In terms of the CO2 emission diagram, both wood frame and concrete-based walls release approximately 11,000 kg of CO2 per square meter of wall. Similarly, they emit 50 kg of NOx per square meter of wall. However, in terms of SO2 emissions, the concrete masonry wall releases slightly more with 30 kg compared to the wood frame wall, which emits 20 kg per square meter.
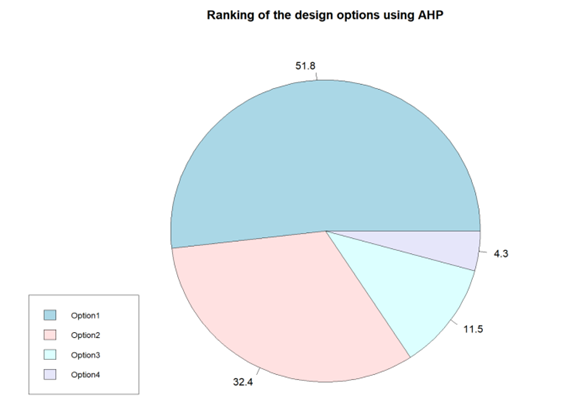
7. MCDM – Analytic hierarchy process (AHP)
In the final section, we establish the analytic hierarchy process (AHP) to see the integrated effect of all our multi criteria based on their importance. Figure 7, represents the result of the multi criteria decision making process. It can be clearly seen that option number 1 has the highest score with nearly 50%, followed by the other natural design option with 32,4 %. Concrete masonry wall also has the lowest score standing less than 5.
Downloadable Content
Full Report: Eisa Sabahi