High-Performance Product
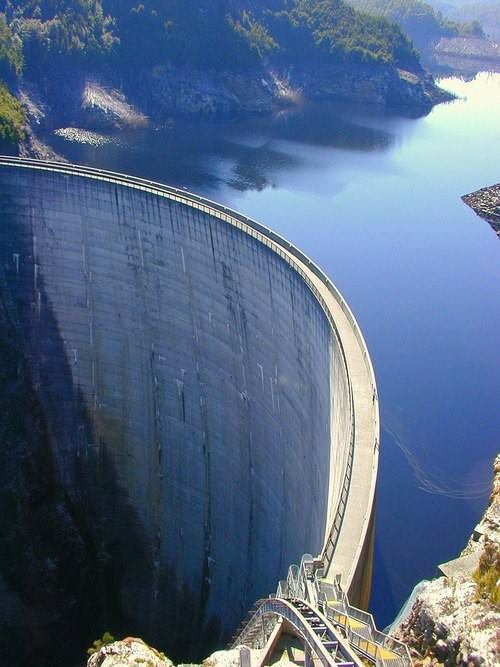
Fig: Overview of a Dam
Throughout its lifetime, a system is subjected to several pressures, and the civil system must sustain numerous high loads. A concrete dam, for example, must endure the enormous pressure exerted by the water body, as well as the changing seasons of the year, which can result in varying water loads. However, because of the time and effort required to build such a complicated system, it must have a lengthy lifespan. For example, a dam should be built to survive at least 120 years, and other subsystems within this integrated system should have a similar lifespan.
As a result, a proper maintenance approach is critical. A dam and a motorway across the dam’s crest are among the systems and subsystems being examined for integration. As a result, dam-related interventions, such as Seepage repair and dam maintenance, will have a higher occurrence frequency than interventions for other systems. As a result, the first difficulty is to harmonize maintenance strategies.
The dam is definitely a complex product to understand its working. There are several kinds of dams based on different functions. Through life cycle analysis we are able to determine and analyze the possibilities of failure as well as the timeline to maintain it.
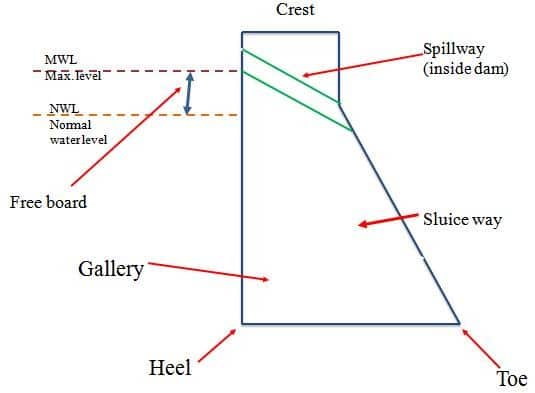
Fig: Schematics of an Arch Dam
Engineering Challenges
The engineering design challenges of the dam include Stress and stability analysis of dam foundations under external loads, earthquake behavior of dam–foundation–reservoir systems, mechanical properties of mass concrete for dams, high-velocity flow, and energy dissipation for high dams, and technical problems of hydropower plants and underground structures. The ultimate aim to take the dam as a system was to classify failure possibilities, Maintenance possibilities and to give a clear idea of the working of the system. Through different analytical methods, we were able to achieve the objective to be met.
Maintenance Planning Criteria
The duration of construction and time to deconstruct is not taken into account when the procedure of maintenance of a combined system is started. Because all of the systems are well integrated into the final system, the maintenance evaluation will begin on April 1, 2022, and the entire design term will be 100 years. Every system’s interventions and frequency are similarly carefully defined at the outset. For the current study, intervention times are always added as days. The overall duration of interruptions is calculated after combining all of the time lines from multiple systems.
Results
For each of the three distinct systems, the occurrences and length of each event are modeled. The frequency and duration of the criteria are determined by the study conducted for each system separately. Because the component systems are around the same size, it was feasible to predict a total lifespan of 100-120 years for the integrated systems. Following an open table debate regarding what types of maintenance are required to be performed and how often they could feasibly be implemented, the three individual systems are simulated for maintenance methods.
Each system’s maintenance is performed one at a time, and no one system is harmed. The aggregate of intervention is computed through iterations for this scenario.
The duration of the three systems is taken to be zero.
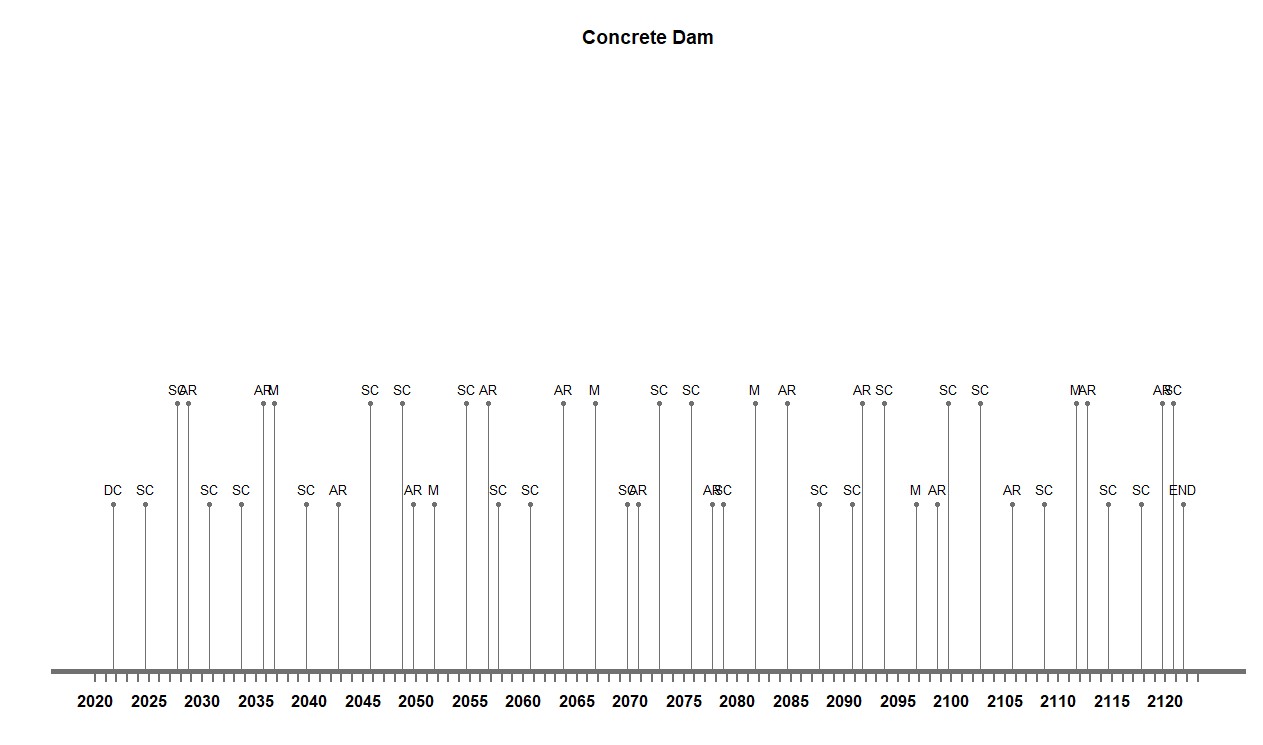
Fig: Timeline of Concrete Dam
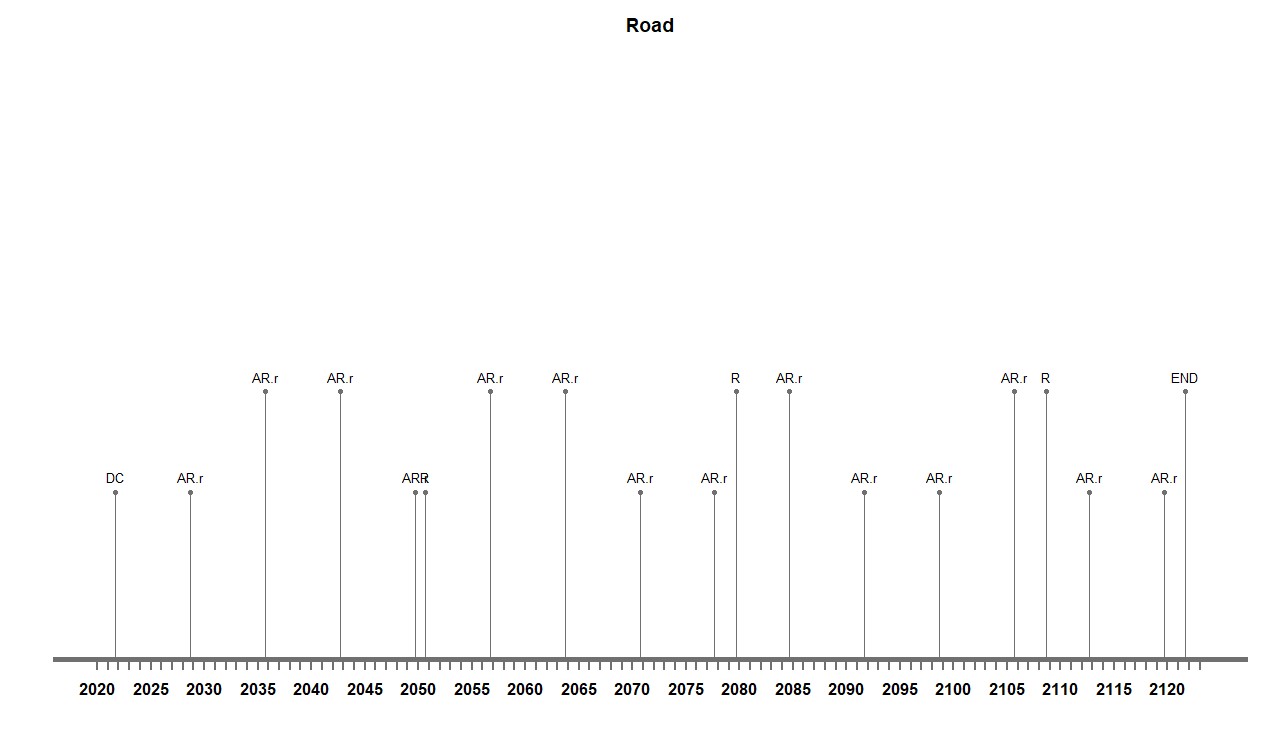
Fig: Timeline of Road
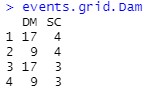
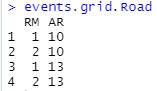
After integrating all of the lifetimes, a total of 197 days of interventions were calculated over a predetermined lifetime of 100 years. This suggests that the individual systems’ maintenance techniques have a limited degree of overlap. Following that, other scenarios were produced by simulating all conceivable outlines of each system with an output of the overall period of interruption. These were achieved using a two-value grid, which implies that two values were retrieved from each frequency range defined for each individual system. The following table shows the various outcomes for each system. Each system’s maintenance is performed one at a time, and no one system is harmed. The aggregate of intervention is computed through iterations for this scenario.
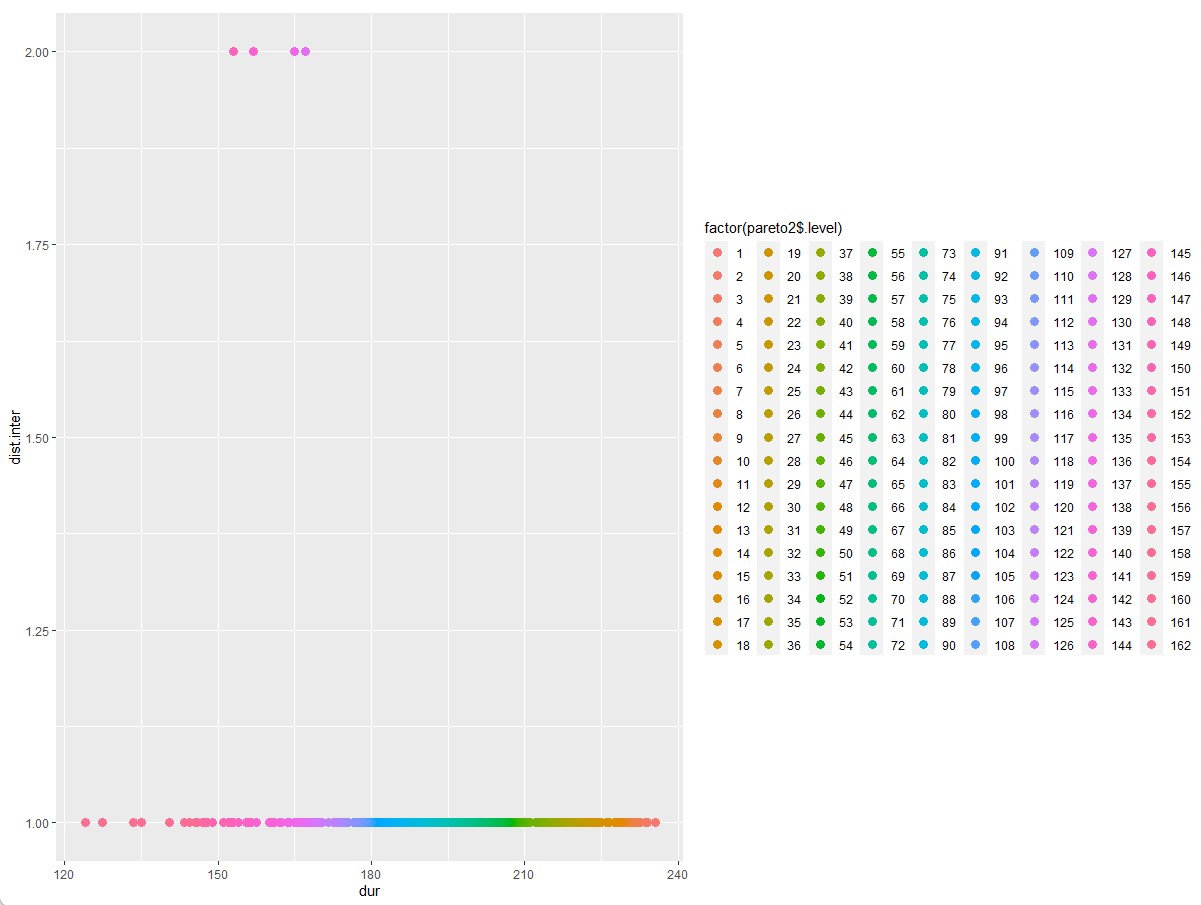
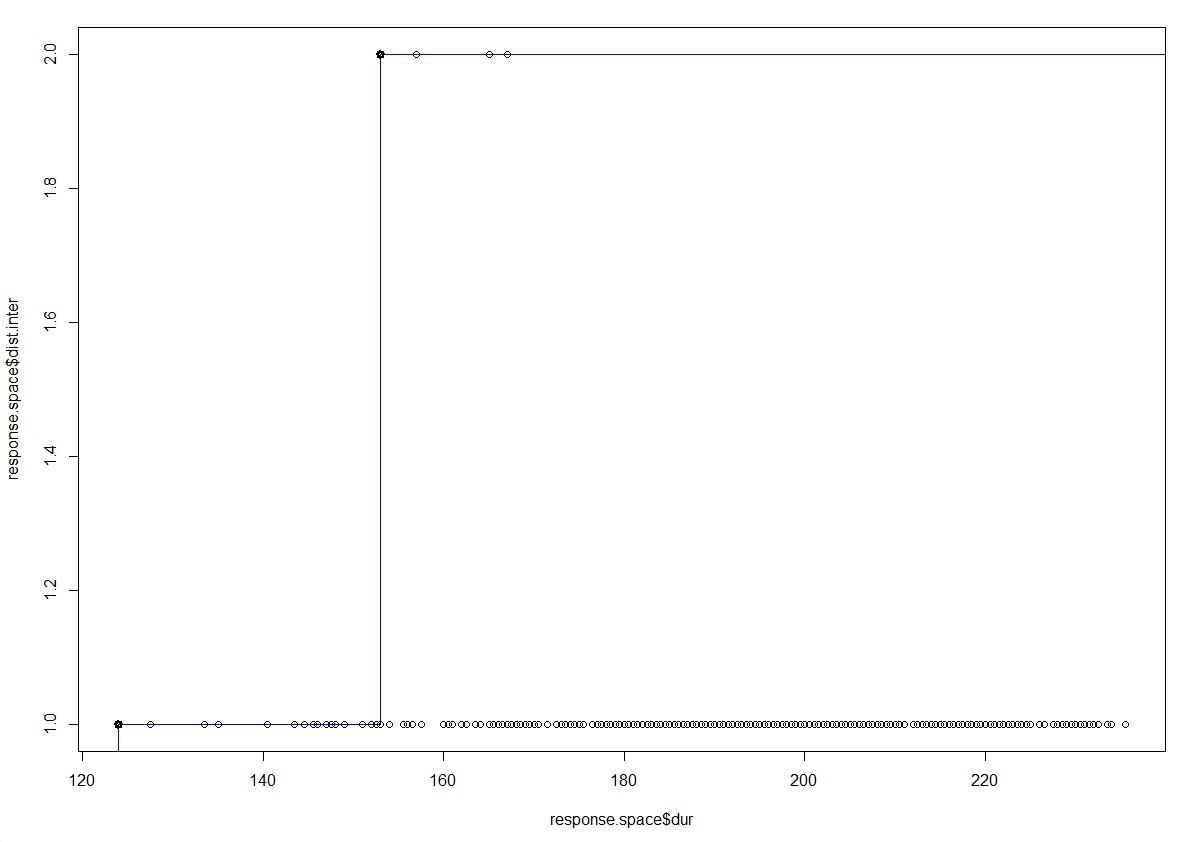
The alternatives we investigated are sorted in this diagram depending on the indicated preference. There are 162 groupings in all. The hue of the highest-rated alternatives is known to us. Using the Pareto Frontier is a good method to improve the graphical representation.
The dark black point in the top-left corner indicated the optimal choice based on the given preferences, while the blue line represented the Pareto frontier. This method ranks the results well, but it is only a ranking mechanism based on predefined preferences.