Method
In the previous parts we analyzed the environmental impact and production cost and determined the best maintenance strategy for the integrated system separately. However, the goal is to have the most functional system with the lowest environmental impact and production cost possible.
Multi-Objective Optimization is used to determine this ideal solution. The genetic Non-dominated Sorting Genetic Algorithm II (NSGA II) is used to determine the Pareto optimal solutions for the system maintenance plan and the length of the office building in order to minimize environmental an production cost and increase its functionality. As before, the system functionality is modeled using the duration of maintenance interventions and the time between these events.
A fitness function is defined which determines the performance of the system’s design and maintenance solutions. Its input is a numeric vector of 10 elements, where the first nine define maintenance scheduling parameters across three intervention categories, and the tenth represents an object-related parameter in this case the office building length. The fitness function conducts an LCA to determine the environmental indicators and production cost and calculates the resulting environmental cost. Based on this results it returns a fitness score , which combines time efficiency, sustainability metrics, and economic costs.
The code implements NSGA-II to optimize the fitness function by evolving a population of solutions over multiple generations. It searches for optimal parameter values evaluating objective criteria.
The algorithm runs for 10 generations with a population size of 100, ensuring diversity in potential solutions. Input values are constrained within specified lower and upper bounds to maintain realistic feasibility. The optimization aims to identify Pareto-optimal solutions that balance multiple competing factors, such as time efficiency, environmental impact, and cost.
Results
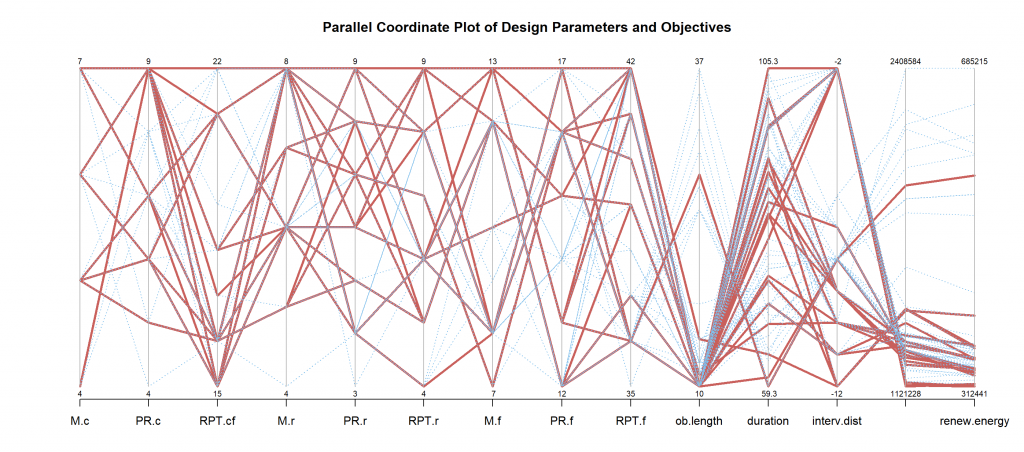
The parallel coordinate plot displays the relations between the different design parameters and the performance indicators.
Red: Pareto-optimal solution
Blue: Non-Pareto solution
The plot shows that in most cases a higher intervention frequency is favorable which is reasonable since higher maintenance frequencies reduce the number of interventions and therefore the environmental impact. But there are exceptions. Especially for the replacement of the wood columns and interior color the low frequency is better. This is unexpected since a frequency of 15 means that the replacement occurs one time more than for the other values. A possible explanation for this is the fact that many interventions can have frequencies which can be divided by five. So a frequency of 15 might align better with the other interventions.
Another striking parameter is the office building length. In almost every scenario the lowest length of 10 m is the optimal solution. This is due to the lower amount of material required resulting in a smaller environmental impact of the system.
A surprising result is that many Pareto-lines run through a medium duration and a smaller distance between interventions rather than through a small duration and a high distance. This might result from the interaction with other parameters but it could also imply that the model is not good enough. Maybe the number of generations are still too small which would lead to sub-optimal results. The negative values for the distance between interventions also implies that there is a mistake within the model.
In the following the Pareto fronts for different pairings of output parameters are analyzed to identify the optimal solutions for the goal.
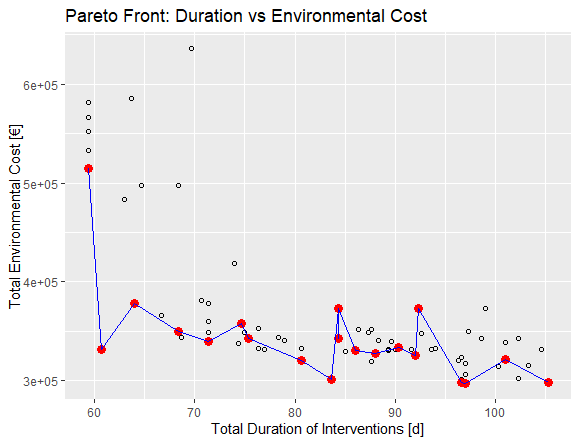
Duration vs Environmental Cost
The goal is to minimize the duration of interventions to ensure a good functionality of the system while reducing the environmental impact as much as possible. The lowest duration of approx. 59 days comes together with the highest environmental cost. However, accepting a lightly higher duration of 61 dysfunctional days already leads to a significant reduction of the environmental cost form 500,000 € to approx. 330,000 €. Further optimization of the environmental cost would cause the system to be not functioning for 81 to 83 days while saving approx. 30,000€ of environmental cost. Since there is no significant improvement of the environmental cost after the duration of 83 days, the other solutions with higher duration do not contribute to the goal.
In conclusion the solutions with the intervention duration of 59 an 83 days are both good solutions that contribute to the goal. The decision can be left to the building owners personal preference. However, the tradeoff for reaching the better environmental cost is not so small with 24 days more in which the system will not be accessible. Therefore, most likely the option with the duration of 59 days will be the preferred option.
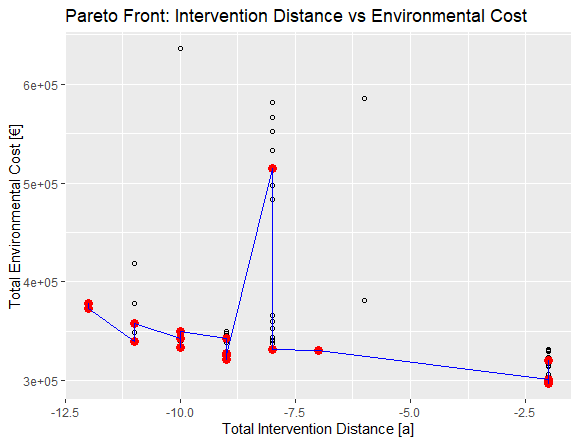
Intervention Distance vs Environmental Cost
In this case the decision for a solution is much clearer. The optimal solution ha a largest distance between interventions and a low environmental impact expressed through the environmental cost. The largest distance between events is -2 which for one solution comes together with the lowest environmental cost. There are other solutions for a distance of -2 with a higher environmental cost but since the are unfavorable to the goal they can be neglected.
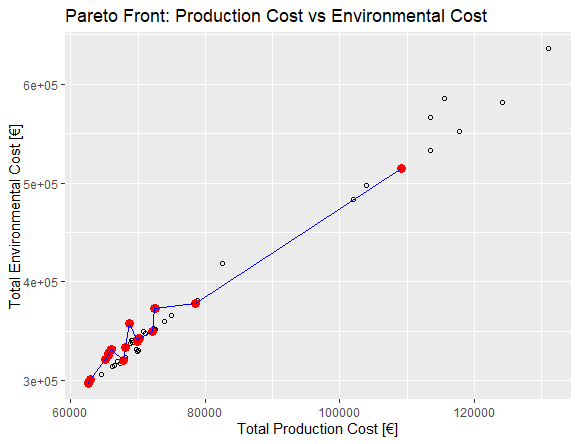
Intervention Distance vs Environmental Cost
The same accounts for the relation between environmental cos and production cost. The best option has a production cost of approx. 62,000 € and an environmental cost of approx. 300,000 € which are the minimum values for both parameters. Considering that a smaller production and material cost are the result of less material consumption meaning that less energy is required as well as a smaller GWP this is a sensible outcome.
Conclusion
Our study proves that a good maintenance strategy is crucial to optimize the functionality an integrated system. A well aligned maintenance schedule can reduce the number of days the system is not working from 325 to 59 days.
A high consumption of non-renewable energy of the system during its lifespan is the main factor contributing to environmental damages in terms of environmental cost. While the number of interventions throughout its lifecycle significantly influences the energy consumption, GWP and material and production cost of the system a well integrated maintenance schedule does not automatically decrease the environmental impact of the system as the Pareto front for “Duration vs Environmental Cost” proves.
This is why multi-objective optimization provides a good method to identify maintenance and design solutions representing the best compromise between a low environmental impact and system functionality and the a low system construction cost and the environmental cost.
The advantage of the multi objective optimization is that it visualizes the impact of tradeoffs. It directly shows the deductions one has to make in one parameter for improving the other parameter. Moreover, it gives engineers the opportunity to weigh up between the tradeoffs and adjust preferences in the end. This is a contrast to the AHP in which the weights representing individual preferences are already assigned in the beginning and therefore included in the results.
On the other hand the results of the multi-objective optimization are not only highly dependent on the data selected for the indicators but also on the scale and scope of the system analysis. It can easily happen that important factors are left out of the analysis due to a lack of data or a conceptional mistake within the model. This could lead to an immense falsification of the results. A similar problem can occur when using data from different sources which might not be comparable.
Another limitation of the multi-objective optimization is that it only allows pairwise comparison. The optimal solution identified for “Duration vs Environmental Cost” most likely differs from the solution chosen for “Intervention Distance vs Environmental Cost”. So the final decision requires even more weighing up which is also dependent on personal preferences.
Assuming that the data used as basis for this model is realistic and correct and there are no mistakes int he implementation, the maintenance integration and LCA combined with the multi-objective optimization is a very helpful measure to support engineers in the decision-making process for a design with conflicting goals. Its strength is sourcing out adding individual preferences to the end when the tradeoffs are visible.
| Main Page | Introduction | Integration Context of the Civil Systems | Maintenance Strategies | Life Cycle Analysis | Multi-Objective Optimization |


