Engineers must make decisions about product configuration, materials, construction, operation, and maintenance at each step. These decisions are linked to life-cycle costs and environmental impact. This example demonstrates the possibility of conducting a life cycle assessment of a keeled composite wall. The goal and scope of this assessment are defined in the following subsection.
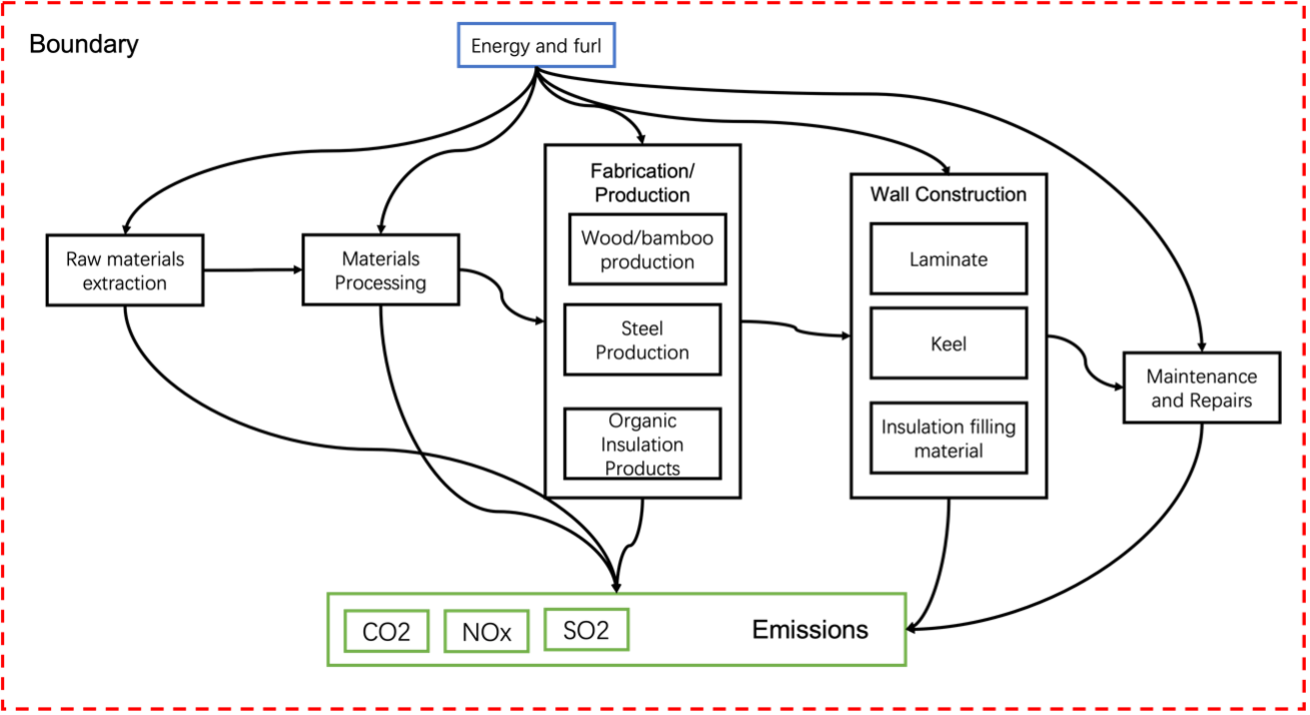
This section defines what we want to achieve by conducting this assessment as well as defining the boundaries of our analysis. The main goal of this is to do a carbon footprint analysis. The scope and the boundaries of the assessment are presented in the figure below.
1.1 Goal and scope of the assessment
This section outlines the objectives and scope of the assessment, with a focus on conducting a carbon footprint analysis. The figure below presents the boundaries of the assessment.
The design alternatives we are going to analyze are presented in the figure below.
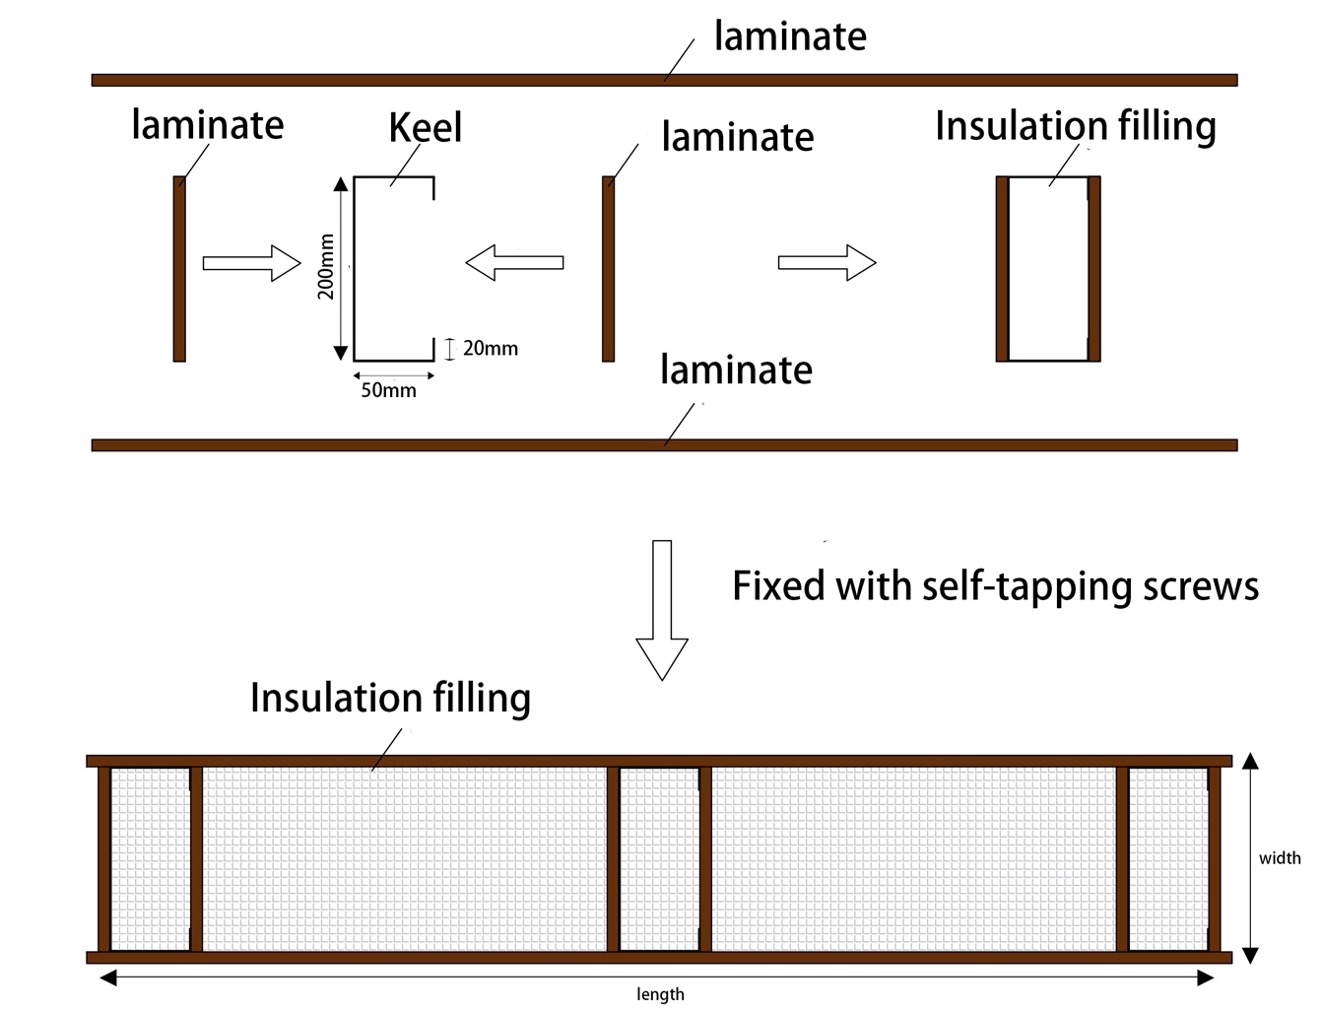
A section of the keeled composite wall is shown. The wall has three main components: metal keel, Laminate, and Insulation filling material. C-shaped thin-walled keel is made of either 304 stainless steel or cold-formed steel in the dimensions shown. Since there is not much difference between stainless steel and cold-formed steel in terms of strength, the thickness of the keel is 0.6mm. laminate will be used on both sides of the keel to strengthen the stability and on both sides of the wall. production methods are similar, but there is a certain gap in mechanical properties, in order to ensure the safety of the design, so the thickness of ply-bamboo is 10mm and the thickness of OSB plate is 8mm. laminate and keel are connected by self-tapping screws (ST4.2X50). In order to meet the thermal insulation needs of the wall, so the internal cavity is filled with insulation material, using Insulation Glass Wool or Foamed polyurethane.
| Design option | Laminate | Keel material | Insulation filling material |
| option 1 | ply-bamboo | stainless steel | Insulation Glass Wool |
| option 2 | ply-bamboo | stainless steel | Foamed polyurethane |
| option 3 | ply-bamboo | cold-formed steel | Insulation Glass Wool |
| option 4 | ply-bamboo | cold-formed steel | Foamed polyurethane |
| option 5 | OSB plate | stainless steel | Insulation Glass Wool |
| option 6 | OSB plate | stainless steel | Foamed polyurethane |
| option 7 | OSB plate | cold-formed steel | Insulation Glass Wool |
| option 8 | OSB plate | cold-formed steel | Foamed polyurethane |
As shown in Table 1, we have a total of 8 kinds of different material combinations.
1.2 Life Cycle Inventory of different materials, Performance, and environmental indicators
The table below shows the composition of the various materials and the associated energy consumption for associated energy consumption for fabrication and processing, CO2, NOx, SO2, and extraction, processing, manufacture, and construction costs.
| material | unit | energy | CO2 | NOx | SO2 |
| ply-bamboo | m³ | 5274.0 | 400 | 0.8 | 0.2 |
| OSB plate | m³ | 8204.0 | 500 | 0.7 | 0.4 |
| stainless steel | kg | 29.3 | 1 | 0.001 | 0.0003 |
| cold-formed steel | kg | 23.4 | 0.6 | 0.0005 | 0.0002 |
| Insulation Glass Wool | m³ | 293.0 | 15 | 0.02 | 0.0005 |
| Foamed polyurethane | m³ | 879.0 | 40 | 0.02 | 0.01 |
| screw | pcs | 0.0054 | 0.0004 | 0.000005 | 0.000002 |
The figures in the table indicate how many megajoules of energy are consumed or how many kilograms of harmful gases are emitted for each unit of the material produced and used.
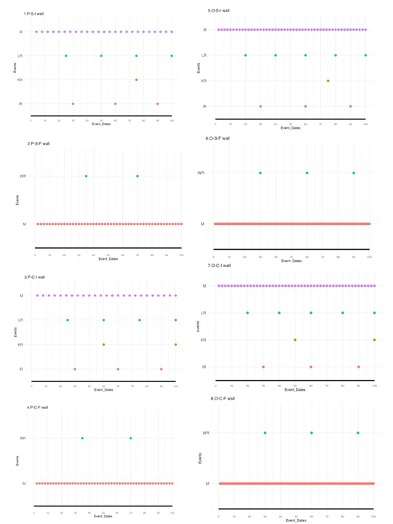
The Life-Cycle timeline is a tool that graphically displays the chronological order of the various phases of the life cycle. With the Life-Cycle timeline, we can see the entire process of a project, product or concept from start to finish.
For the current modeling, we have a list of interventions. In the design option, I have used initials instead of individual options for ease of presentation.
| DesignOption | Event | Frequency | TotalLifespan |
| 1.P-S-I wall | LR | 25 | 100 |
| 1.P-S-I wall | KR | 75 | 100 |
| 1.P-S-I wall | IR | 30 | 100 |
| 1.P-S-I wall | M | 4 | 100 |
| 2.P-S-F wall | WR | 35 | 100 |
| 2.P-S-F wall | M | 2 | 100 |
| 3.P-C-I wall | LR | 25 | 100 |
| 3.P-C-I wall | KR | 50 | 100 |
| 3.P-C-I wall | IR | 30 | 100 |
| 3.P-C-I wall | M | 4 | 100 |
| 4.P-C-F wall | WR | 35 | 100 |
| 4.P-C-F wall | M | 2 | 100 |
| 5.O-S-I wall | LR | 20 | 100 |
| 5.O-S-I wall | KR | 75 | 100 |
| 5.O-S-I wall | IR | 30 | 100 |
| 5.O-S-I wall | M | 2 | 100 |
| 6.O-S-F wall | WR | 30 | 100 |
| 6.O-S-F wall | M | 1 | 100 |
| 7.O-C-I wall | LR | 20 | 100 |
| 7.O-C-I wall | KR | 50 | 100 |
| 7.O-C-I wall | IR | 30 | 100 |
| 7.O-C-I wall | M | 2 | 100 |
| 8.O-C-F wall | WR | 30 | 100 |
| 8.O-C-F wall | M | 1 | 100 |
P-ply-bamboo
O- OSB plate
S- stainless steel
C- cold-formed steel
I- Insulation Glass Wool
F- Foamed polyurethane
LR- Laminate replacement
KR-Keel replacement
IR- Insulation filling material replacement
WR-Wall rebuild
M- Maintenance
Here’s the result
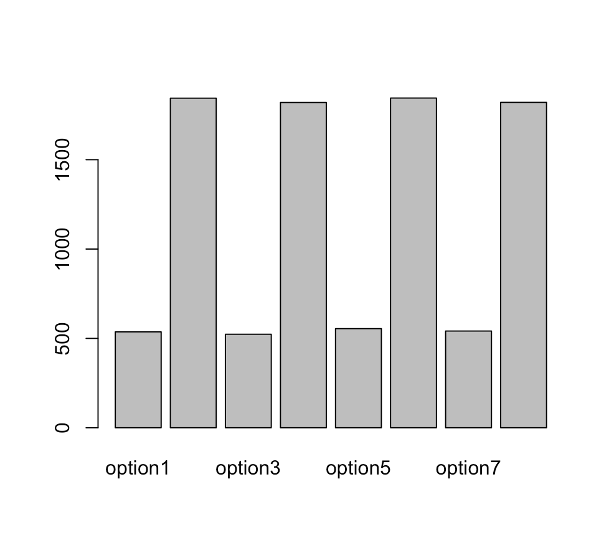
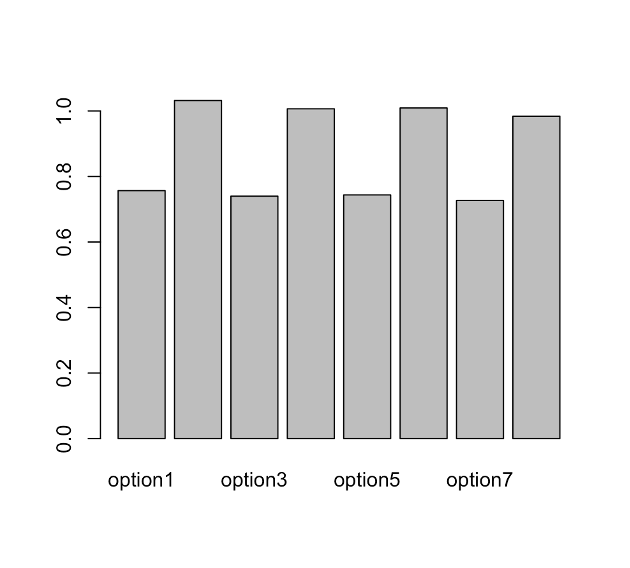
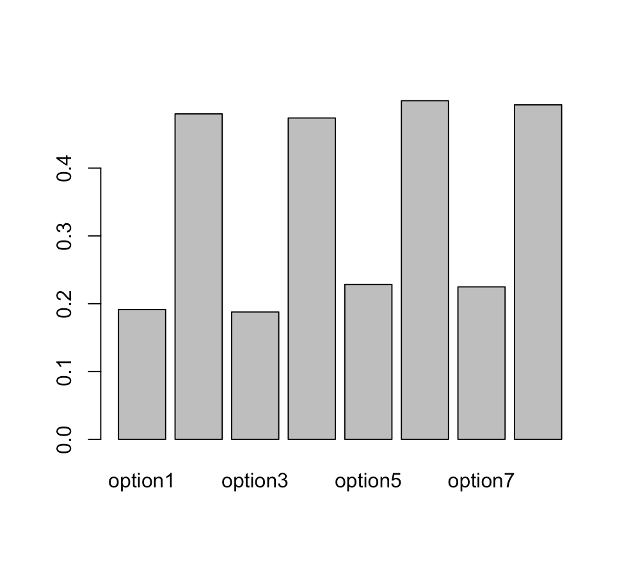
3. Life Cycle Inventory and Analysis
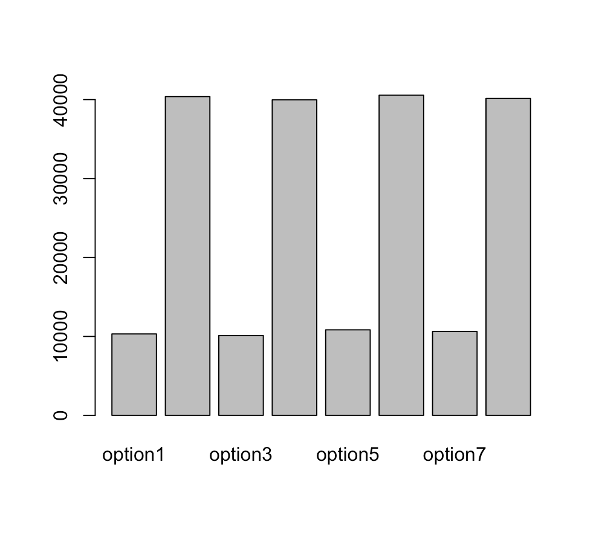
As we analyse how and how many interventions are required over the lifecycle of each option, combined with the data from table 2, we can multiply and add up the overall lifecycle energy consumption and emissions for each option. Here are the results:
4. MCDM – Analytic hierarchy process (AHP)
Multi-criteria Decision Making Method (MCDM) is a methodology applied to decision problems dealing with multiple criteria and multiple choices. In MCDM, the Analytic Hierarchy Process (AHP) is a commonly used tool for hierarchy and comparison in complex decision problems.
The basic idea of AHP is to decompose a large decision problem into multiple levels and refine it from top to bottom level into several relatively simple decision sub-problems. Then, by comparing the elements at different levels, weights and priorities are established, and finally a comprehensive decision result is reached.The uniqueness of AHP is that it takes into account the decision maker’s subjective preferences for different factors and ensures the stability and reliability of the decision-making process through consistency testing.
We need to compare each option two by two and give saaty grades for assigning values and the results are as follows:
| Energy | option 1 | option 2 | option 3 | option 4 | option 5 | option 6 | option 7 | option 8 |
| option1 | 1 | 1/9 | 3 | 1/9 | 1/4 | 1/9 | 1/2 | 1/9 |
| option2 | 9 | 1 | 9 | 3 | 9 | 1/2 | 9 | 2 |
| option3 | 1/3 | 1/9 | 1 | 1/9 | 1/4 | 1/9 | 1/3 | 1/9 |
| option4 | 9 | 1/3 | 9 | 1 | 9 | 1/4 | 9 | 1/2 |
| option5 | 4 | 1/9 | 4 | 1/9 | 1 | 1/9 | 2 | 1/9 |
| option6 | 9 | 2 | 9 | 4 | 9 | 1 | 9 | 3 |
| option7 | 2 | 1/9 | 3 | 1/9 | 1/2 | 1/9 | 1 | 1/9 |
| option8 | 9 | 1/2 | 9 | 2 | 9 | 3 | 9 | 1 |
| CO2 | option 1 | option 2 | option 3 | option 4 | option 5 | option 6 | option 7 | option 8 |
| option1 | 1 | 1/9 | 2 | 1/9 | 1/2 | 1/9 | 1/2 | 1/9 |
| option2 | 9 | 1 | 9 | 3 | 9 | 1 | 9 | 4 |
| option3 | 1/2 | 1/9 | 1 | 1/9 | 1/4 | 1/9 | 1/3 | 1/9 |
| option4 | 9 | 1/3 | 9 | 1 | 9 | 1/3 | 9 | 1 |
| option5 | 2 | 1/9 | 4 | 1/9 | 1 | 1/9 | 2 | 1/9 |
| option6 | 9 | 1 | 9 | 3 | 9 | 1 | 9 | 4 |
| option7 | 2 | 1/9 | 3 | 1/9 | 1/2 | 1/9 | 1 | 1/9 |
| option8 | 9 | 1/4 | 9 | 1 | 9 | 1/4 | 9 | 1 |
| NOx | option 1 | option 2 | option 3 | option 4 | option 5 | option 6 | option 7 | option 8 |
| option1 | 1 | 1/9 | 2 | 1/9 | 1/6 | 1/9 | 1/6 | 1/9 |
| option2 | 9 | 1 | 9 | 2 | 9 | 1/6 | 3 | 1/6 |
| option3 | 1/2 | 1/9 | 1 | 1/9 | 1/7 | 1/9 | 1/7 | 1/9 |
| option4 | 9 | 1/2 | 9 | 1 | 5 | 2 | 5 | 1/9 |
| option5 | 6 | 1/9 | 7 | 1/5 | 1 | 1/9 | 2 | 1/9 |
| option6 | 9 | 6 | 9 | 1/2 | 9 | 1 | 9 | 2 |
| option7 | 6 | 1/9 | 7 | 1/5 | 1/2 | 1/9 | 1 | 1/9 |
| option8 | 9 | 6 | 9 | 9 | 9 | 1/2 | 9 | 1 |
| SO2 | option 1 | option 2 | option 3 | option 4 | option 5 | option 6 | option 7 | option 8 |
| option1 | 1 | 1/9 | 2 | 1/9 | 1/6 | 1/9 | 1/6 | 1/9 |
| option2 | 9 | 1 | 7 | 2 | 5 | 1/4 | 4 | 7 |
| option3 | 1/2 | 1/7 | 1 | 1/9 | 1/4 | 1/9 | 1/4 | 1/9 |
| option4 | 9 | 1/2 | 9 | 1 | 5 | 1/4 | 4 | 1/4 |
| option5 | 6 | 1/5 | 4 | 1/5 | 1 | 1/7 | 2 | 1/7 |
| option6 | 9 | 4 | 9 | 4 | 7 | 1 | 7 | 1 |
| option7 | 6 | 1/4 | 4 | 1/4 | 1/2 | 1/7 | 1 | 1/7 |
| option8 | 9 | 7 | 9 | 4 | 7 | 1 | 7 | 1 |
We also need to rank the importance of the indicators.
| Energy | CO2 | Nox | SO2 | |
| Energy | 1 | 5 | 7 | 3 |
| CO2 | 1/5 | 1 | 4 | 1/3 |
| Nox | 1/7 | 1/3 | 1 | 1/7 |
| SO2 | 1/3 | 3 | 7 | 1 |
With the calculations, we end up with the following results:
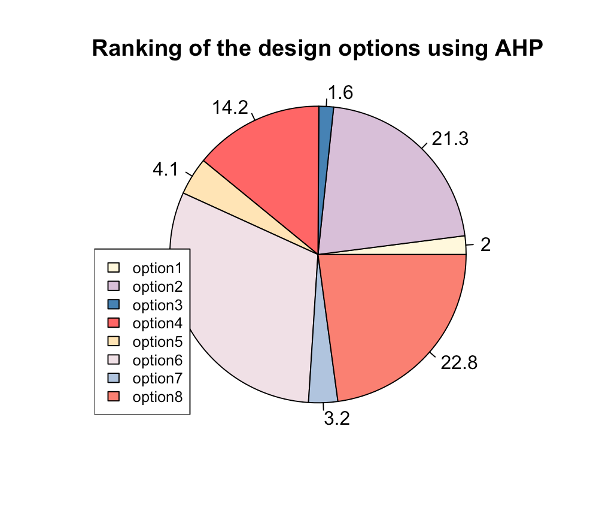
It can be seen that option 3 has the highest score, consumes less energy, and has low emissions. So we choose option 3.