Risk Based Assessment
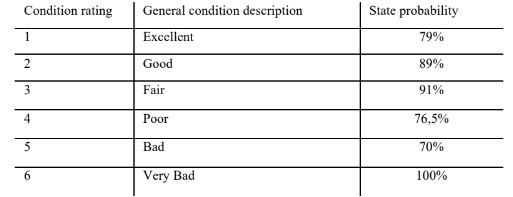
The main focus here is on the failure of the system. For the consideration of the system degradation over the lifetime, condition states in which the system can be located are defined. These will change over time with a certain probability. For this purpose, a statistical model is constructed with the need for state probabilities. Failure modes are defined for the further development of the model. These describe what kind of events can change the system in terms of stability, load capacity, or durability. With the help of failure probabilities of certain events, the reliability of the overall system is determined. As a result, the failure probability for the entire system is obtained for the case that certain events occur.
The below table represents the possible states of the building during its lifetime:
LCA & MCDA
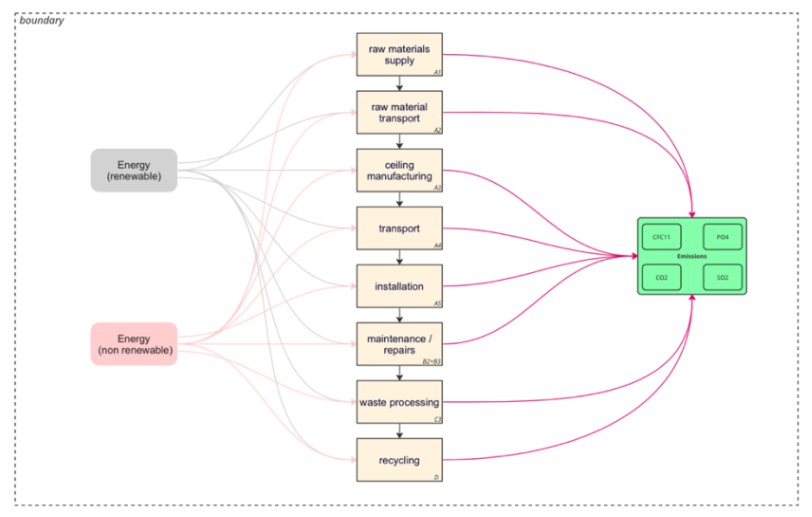
The goal of the LCA is to do a carbon footprint analysis to compare the design options of the system. For the scope the definition of what type of footprint analysis is helpful. In this assignment the focus is on the global warming potential (GWP – CO2), the depletion potential of the stratospheric ozone layer (OP – CFC11), the acidification potential (AP – SO2), and the eutrophication potential (EP – PO4). Also in consideration is the total consumption of non-renewable primary energy resources (PENRT) and the total use of renewable primary energy resources (PERT). The LCA focuses on the first phases of a system until the installation (A1-A5) and also looks at the waste processing (C3) and recycling potential (D) – according to the EN standard of the life-cycle stages [1]. Maintenance and repairs are also part of this study.
The below figure represents the scope and the boundaries of the assessment:
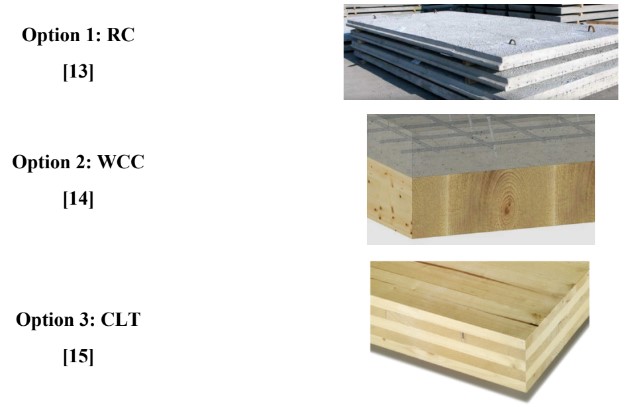
The below figure represents different design options for system:
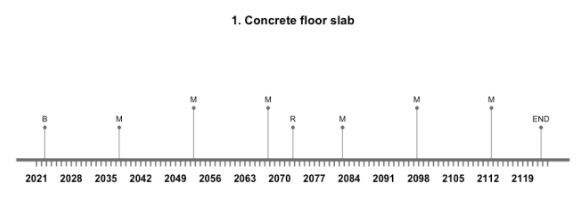
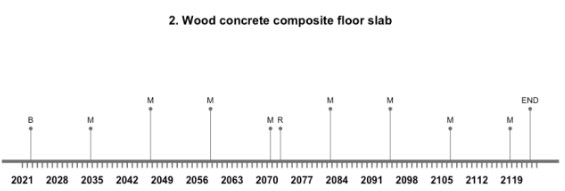
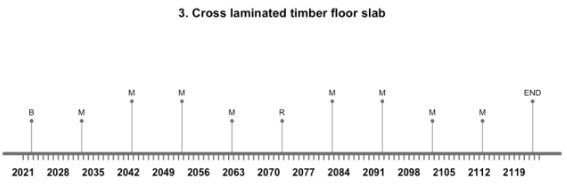
Life Cycle Timeline: To start the life cycle analysis it is necessary to define the lifespan of the chosen system. It is also important to define the events that occur during lifetime regarding maintenance activities – like maintenance, repairs or rebuilding. A service life of 100 years is assumed for the building and the floor slab.
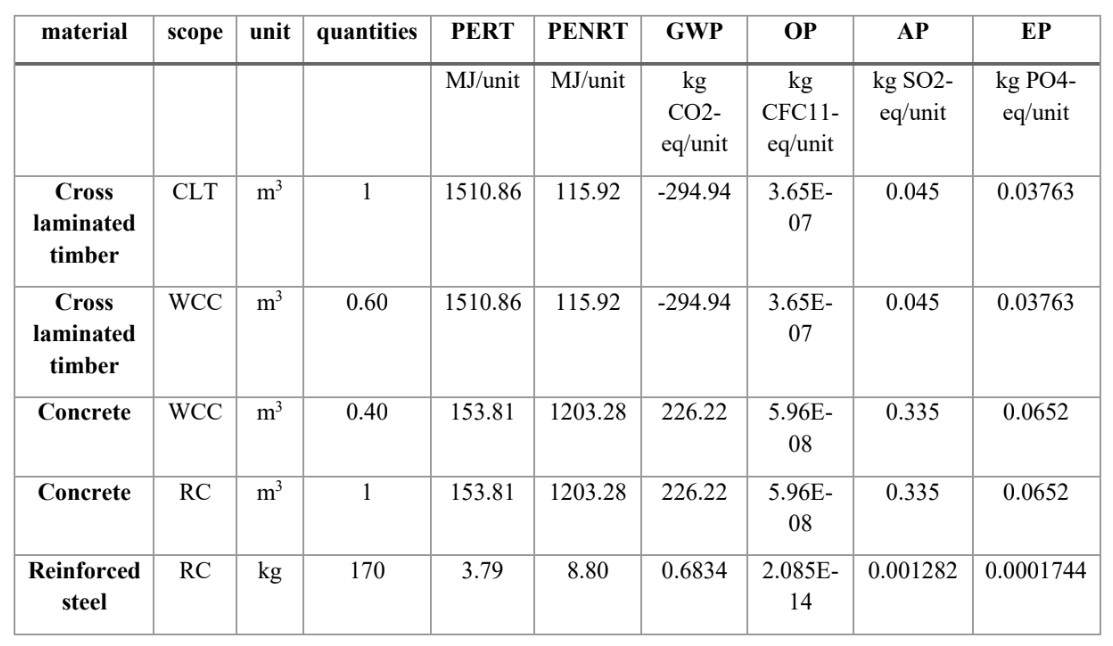
Life Cycle Inventory: In the scope column the affiliation to the different design options is shown. For the quantities different numbers with different meanings are presented. For 1m3 WCC, 60% of CLT and 40% of concrete are needed, according to the cross section area. For 1m3 RC, 1m3 concrete and 170kg reinforced steel are needed. Respective reinforced steel, which is indicated in per kilogram, every material is specified per cubic meter, shown in the unit column.
The below figure represents the life cycle inventory:
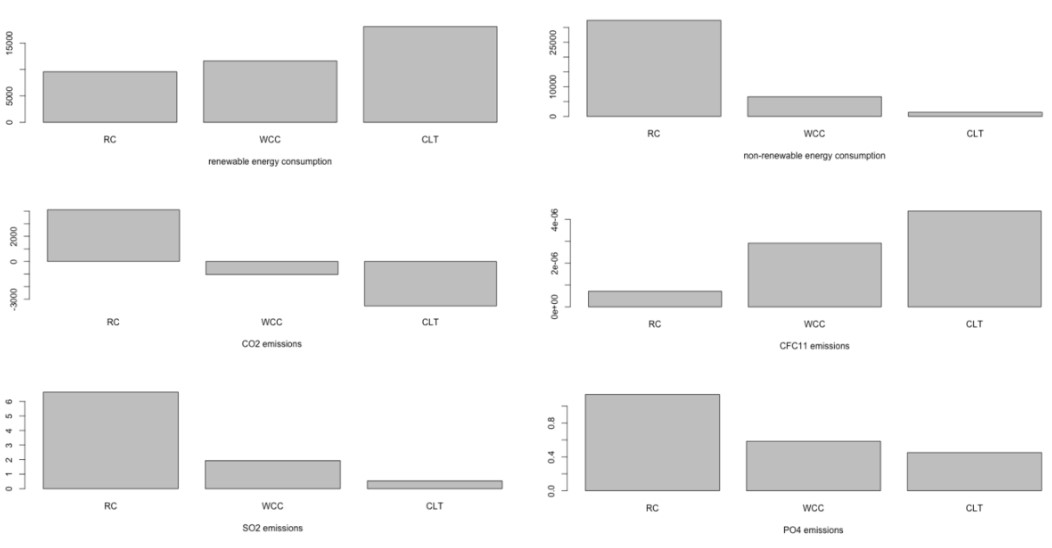
The results show that RC has the highest values for every indicator instead of renewable energy consumption and CFC11 emissions. CLT shows the best values for CO2 emissions, SO2 emissions, PO4 emissions and non-renewable energy consumption. The negative values of WCC and CLT at the CO2 emissions can be explained with the fact, that trees save CO2 and store it over their lifetime – also when they become processed to wood products for the building industry. That CLT has the worst records for CFC11 emissions can be explained with the fact that 86 % of the CFC11 emissions. The high amount of renewable energy consumption came from 65 % by the semi-finished wood product upstream chain, electricity consumption and heating purposes in the factory with wood.
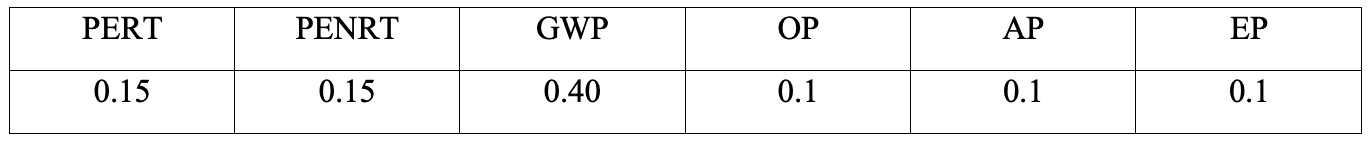
To start the TOPSIS method the definition of weight indicators is essential. The decision was made considering the goal of the study is to look at the carbon footprint. Therefore the GWP got the highest weight because CO2 is the most important greenhouse gas. What is also interesting to look at is the energy consumption, so they got also higher weight than OP, AP and EP.
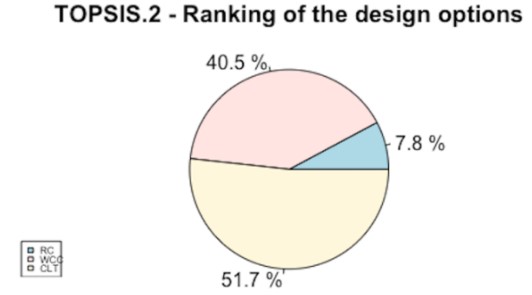
According to [2] and [3], the positive (PIS) and negative ideal solutions (NIS) were calculated.The pie plot TOPSIS.2 show clear results. The variant made of CLT is rated best with 51.7 %, followed by WCC with 40.5 %. RC is rated worst with 7.8 %. Compared with the TOPSIS.1 results – without the integration of the PIS and NIS – the results are almost identical. This shows that the calculation of the TOPSIS method has already given correct results in the first computation and the PIS and NIS only cause very small changes (0.01 % – 0.1 %). Based on the results of the LCA and TOPSIS, CLT is chosen as the most suitable alternative, as the environmental impact of wood – especially CO2 emissions – is the lowest. Whenever possible, wood as a building material should at least be considered instead of concrete. If wood and concrete are combined in WCC, the advantages of both materials can be combined and the environmental impact is less severe than for RC floors.
TOPSIS: 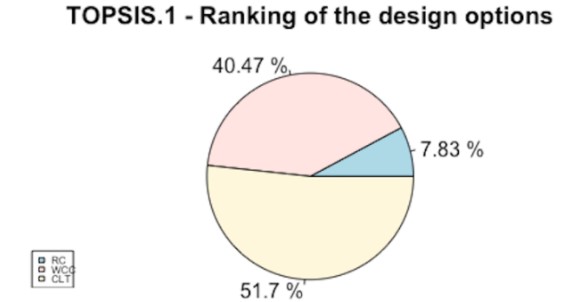
references:
[1] Castro, R. Pasanen, P. How to design buildings with Life Cycle Assessment by accounting for the material flows in refurbishment. 2019.
[2] Pavic, Z. Novoselac, V. Notes on TOPSIS Method. 2013 (retrieved https://www.researchgate.net/publication/285886027_Notes_on_TOPSIS_Method)
[3] Wardoyo, H. Wardoyo, R. The complexity calculation for group decision making using TOPSIS algorithm. 2016. (retrieved https://aip.scitation.org/doi/pdf/10.1063/1.4958502)
Other Systems: