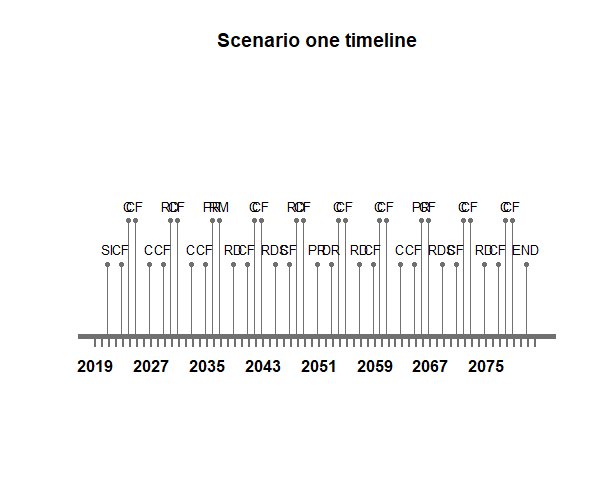
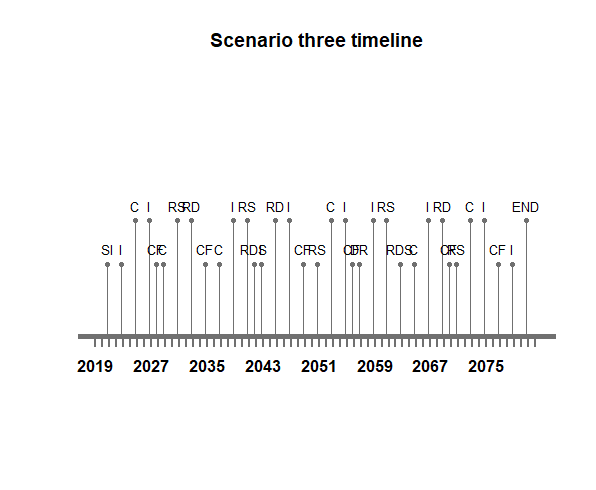
The interventions in the maintenance plans of the individual systems and in their integration into an integrated maintenance plan can be combined and bundled in many ways. Each combination of the points in time of the interventions represents a certain separate scenario.
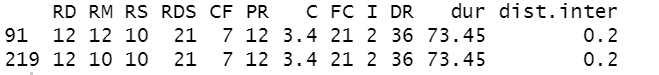
The process of trying out different options of timing the maintenance interventions and therefore obtaining multiple different maintenance scenarios can be automated. This is based on defining a certain range of possible times for each intervention and a parameter defining the time-step for varying the timing. By that 1024 maintenance scenarios were identified. For every time the sampling algorithm is used to generate different scenarios the values are randomly sampled, which gives different results for each time. From running the code four times produces the four preferred maintenance scenarios with different sets of maintenance interventions are obtained, which are detailed in the following. After that, an overview of all scenarios is visualized and the pareto frontiers for the total duration of all interventions and the minimal distance between these interventions are shown in a plot and analyzed.
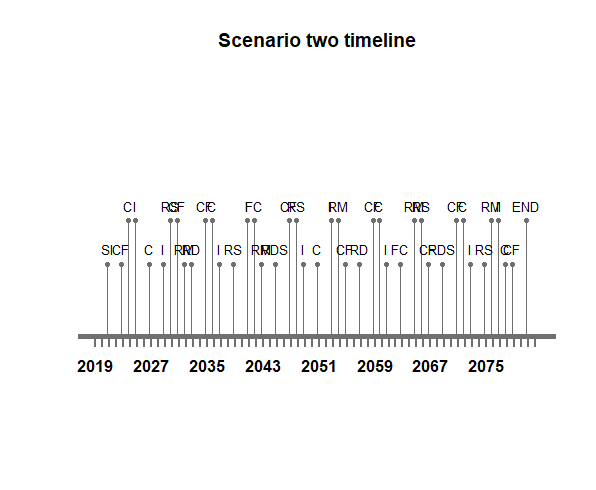
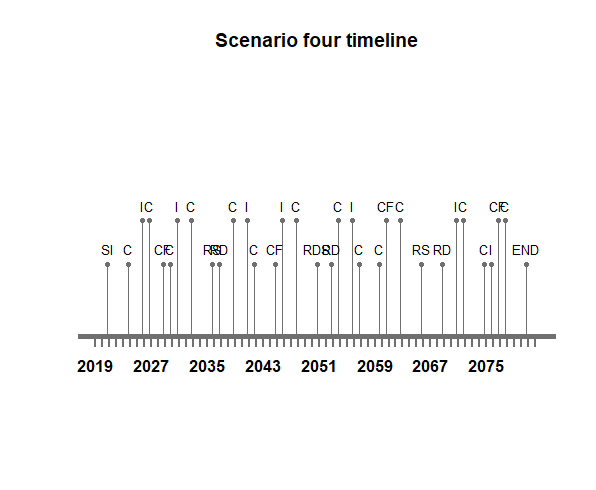

The following figure visualizes all the maintenance scenarios, which were automatically created by the previously mentioned method.
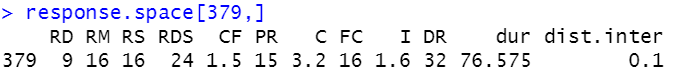
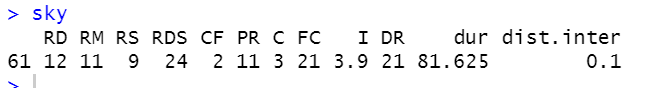
On the left side of the figure, the scenarios are presented in 379 groups over the two factors distance between interventions and total duration of interventions. The scenario alternatives are ranked by the predefined preference function of maximizing the time between interventions and minimizing the time of interventions, which present the time in which the system is not functional due to the maintenance interventions. based on the preference function. The ranking of the groups of scenarios is visualized by their color with pink-to-red representing the least desired scenarios and orange the favored targeted solution. From that visual representation it is difficult to identify the highest rated scenario.
For a better visualization, the pareto frontiers for the two factors distance between interventions and total duration of interventions is plotted and shown in the following figure.
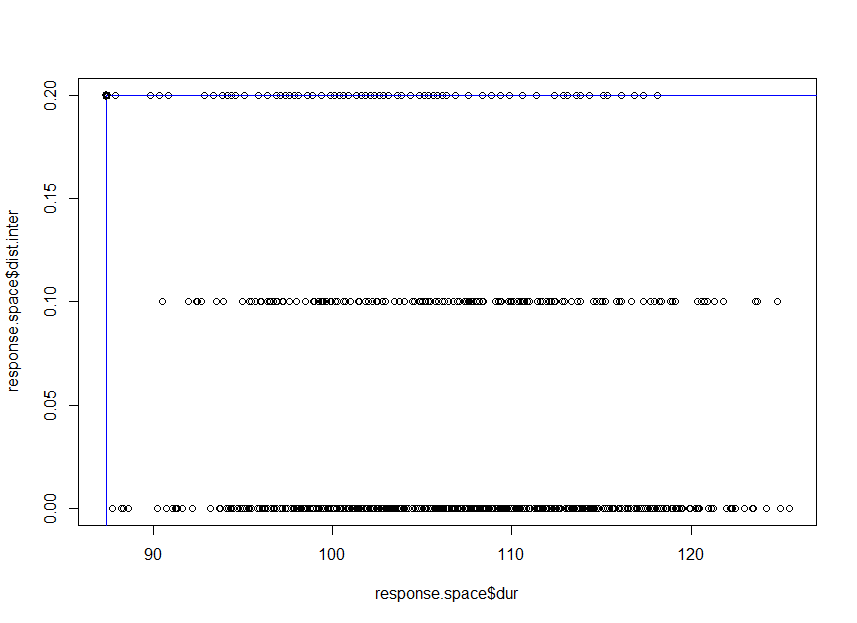
The pareto frontier is displayed as the blue line. Located on the pareto frontier, the dark black point in the top-left corner represents the highest ranked scenario. Ultimately, however, the ranking is solely based on the predefined function.
Another method of finding the best maintenance plan among all scenarios is conducted in the later part of the present project where the ranking is defined as a multi-objective optimization problem, which is solved by applying a genetic algorithm.
Navigation
Integrated maintenance planning