Multi-Objective Optimization and Pareto analysis
A multi-objective optimization recognizes that, when multiple objectives are in conflict, there is no single “best” solution that simultaneously optimizes all criteria. Instead, there are typically trade-offs: improving one objective (e.g., reducing cost) may worsen another (e.g., increasing maintenance duration).
In this study, we analyzed three systems with potentially conflicting objectives. As an example, one option might result in lower costs but lead to a longer total maintenance period, whereas another might reduce maintenance time but increase environmental impact.
Pareto Analysis
To address these trade-offs, we employed a Pareto analysis, which identifies a set of optimal solutions where no objective can be improved without worsening at least one other. This set is known as the Pareto frontier. Any solution on the Pareto frontier is considered “optimal” in the sense of Pareto dominance, while solutions not on the frontier are suboptimal because there exists at least one other solution that is strictly better in all objectives or better in one objective without being worse in the others. These before-hand optimizations are discussed in the section 2. Integration Context. Therefore, in this section we only evaluate options that hinders one design consideration, and enhances the other.
Design Space Exploration
- Design space definition:
We specified a design space for each system. For instance, four maintenance actions for the wind turbines, three for the offshore structure, and one for the breakwater that are evaluated within a defined interval for maintenance actions. - Metrics of interest:
For each combination, we computed key performance indicators: total duration of interventions (sum of all maintenance events across the systems) and minimum distance between consecutive events (a measure of how clustered or spaced out the interventions are). Also, we evaluated the emissions released for these interactions, and the total emission costs for these options. - Preferences:
We sought to minimize the total duration of maintenance interruptions and maximize the distance between interventions. Thus, the Pareto analysis aimed to find solutions that best balanced these two objectives. - Results Visualization:

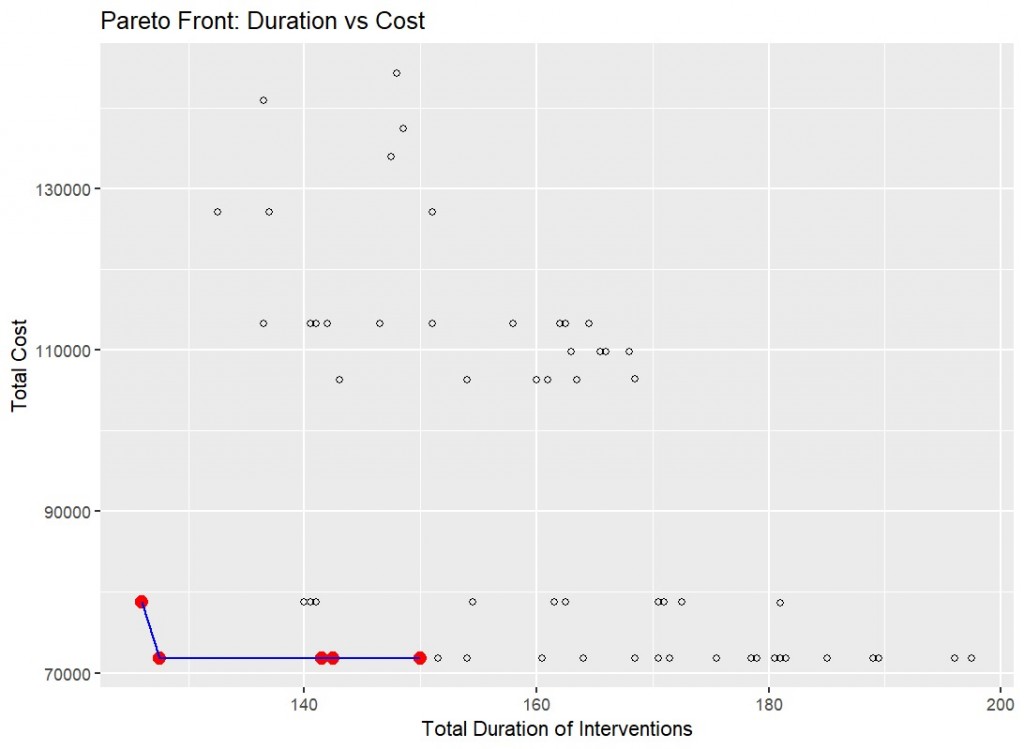
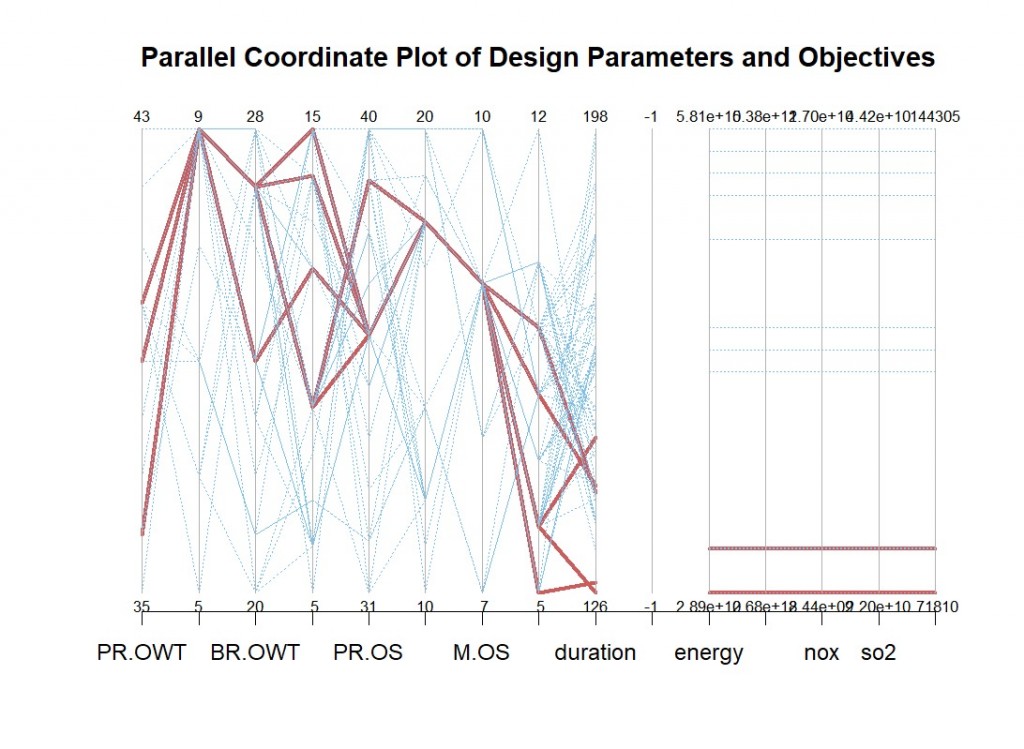
In our application of the Figure-1 above, we are choosing to prioritize lowering the duration of total maintenance events and the cost at the same time. The knee shape that is highlighted with blue line and red dots show the pareto optimal options for these variables from various options we ran in the model. Now in the second figure below, we will implement other objectives and parameters to a parallel coordinate plot to enhance our multi-objective optimization. We also color-coded the solutions according to whether they belong to the Pareto front (optimal, shown in red) or are dominated (suboptimal, shown in blue).

Final Discussion, Limitations, and Future Steps for Improvement
On the left side of the graph there are 4 red lines and in the end there is two. We interpret from this and the results we collected that, on the right side of the graph the red-lines are overlapping. Since the red lines in the graph show optimal solutions, this means there are more than one optimal solution having similar duration, emissions, and cost. To evaluate this model further we generated another plot that is scaled.

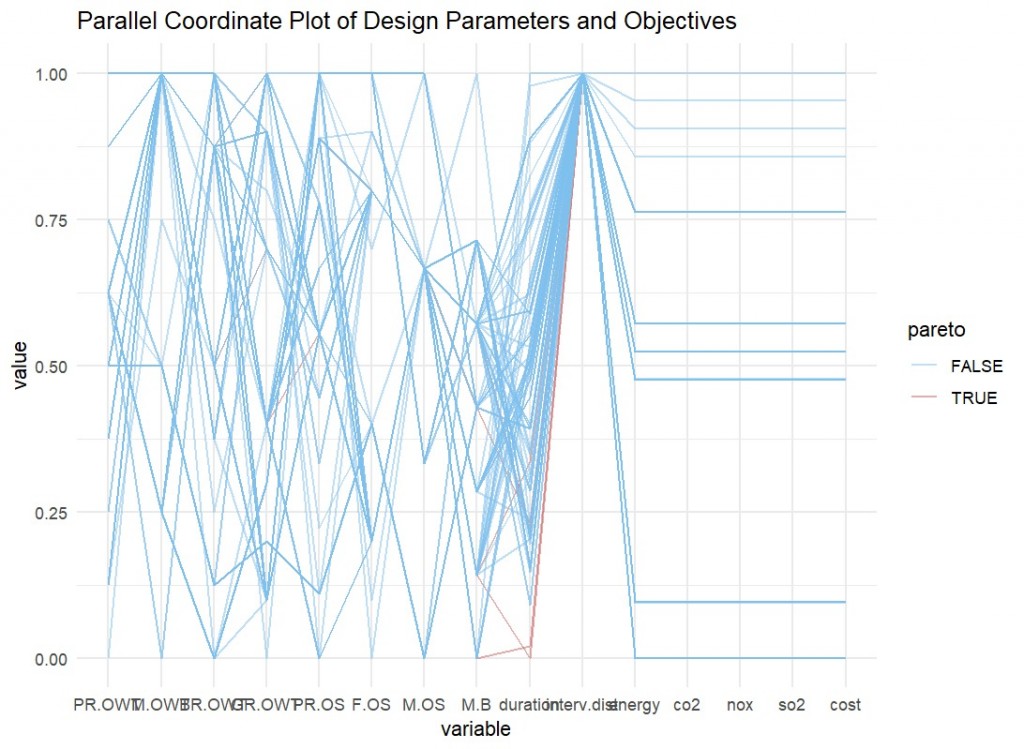
As it can be seen from figure-3, the interpretation we concluded holds true, and the values vary as we scale the plot. It can be concluded that for different events depending on unique situations and projects; if some variables that holds more value than the others per case than the final selected option may vary. In that case it would be up to the authorities and the maintenance management team to evaluate further.
Another result we see from the plot as on intervention distance, due to the selected frequencies, and the integrated maintenance models we had, interv.distance value produces only one result as it can be seen in Figure-3. As this differ from different samples taken on each run of the model, it causes a jump on the unscaled plot. This warrants a review of the input parameters if a more diverse exploration is desired.
- The Pareto front helps decision-makers understand the trade-offs and select a design that balances the various objectives according to their preferences (e.g., cost vs. maintenance time vs. environmental impact).
- Implementing a weight system between different objectives on the right hand side of the final plots, can help decision making greatly when the importance between objectives can be identified.
- Observing that one objective (distance between events) barely changes may indicate either the design space is too narrow or the intervention definitions are fixed in a way that does not allow variability.
- A next step would be to expand or refine the design space (e.g., more grid points or continuous ranges) or apply an evolutionary algorithm to systematically search for a broader set of possible solutions.
- Finally, refining data visualization—such as using parallel coordinates with proper scaling or including interactive plots—can further clarify the relationships among the multiple objectives.
- While these three systems form the core of the integration, additional components may be necessary for an optimal design, including the energy storage systems, specialized vessels for maintenance for both oil platform and wind turbine requirements, and environmental monitoring infrastructure.