RISK-BASED ASSESSMENT & SYSTEMS CONDITIONS.
The research problem area for this assessment is the deterioration of asphalt pavement during its lifetime. The design life of traditional asphalt pavement is 15 years, and the long-life pavement with a moderate increase of pavement strength and asphalt mixture base thickness can obtain 50 years or more of service life, and here we assume that its life is 20 years. We need to establish various models to study the deterioration of asphalt pavement with time, including self-deterioration and deterioration caused by external factors.
The results show that the repair strategy we implemented increases the probability that the pavements will remain in “good” condition. However, this probability is only a little over 40%, although it is higher than that in other states. We can increase this possibility by exploring various maintenance scenarios. Of course, at this point, another decision that engineers can make is to relax the maintenance plan in order to reduce costs.
LIFE CYCLE ANALYSIS & MULTI-CRITERIA DECISION MAKING.
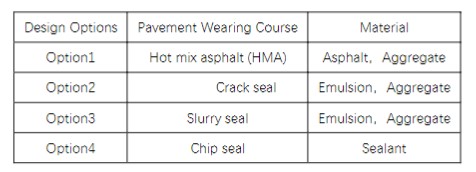
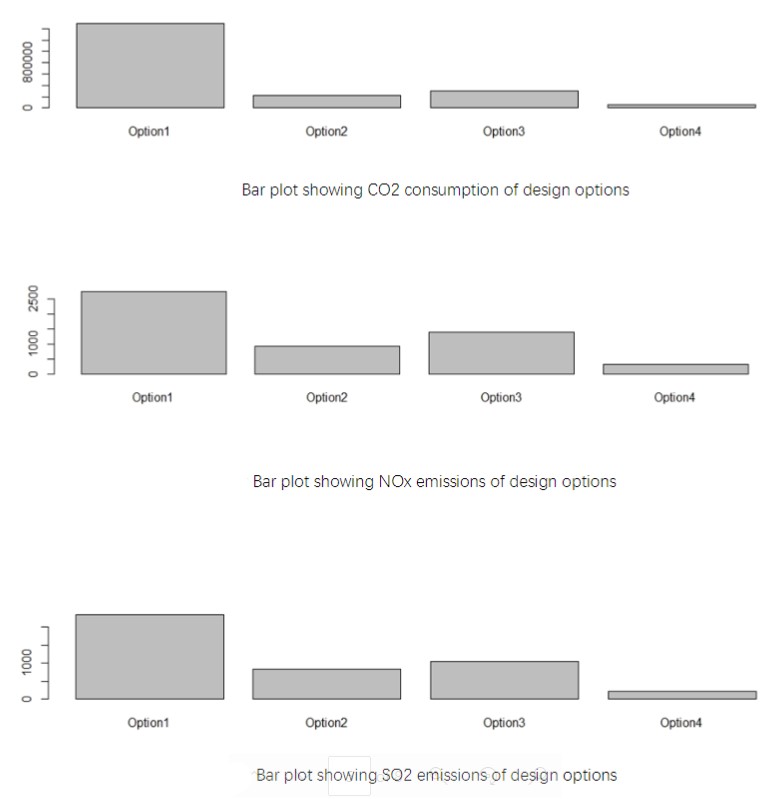
The main goal of the assessment is to do a carbon footprint analysis. The research object here is the wearing layer of pavement, mainly discussing four design options (hot mix asphalt (HMA) overlay, chip seal, slurry seal, and crack seal) in the whole life cycle (raw material, manufacturing, and placement, transport, maintenance, and repairs) and released greenhouse gases and harmful gases (mainly CO2, SO2, NOx) on the natural environment.
The below figure represents the scope and the boundaries of the assessment:
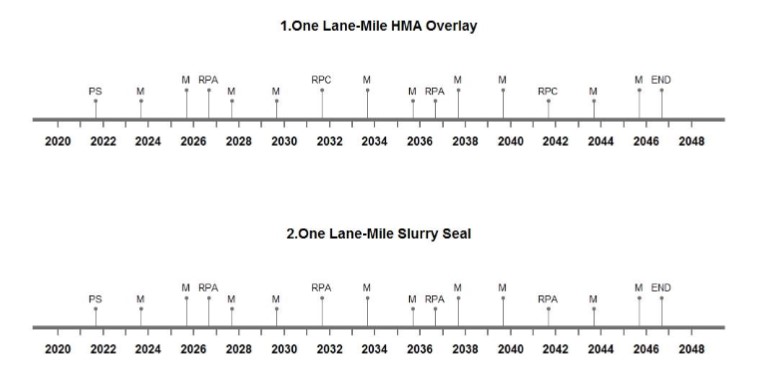
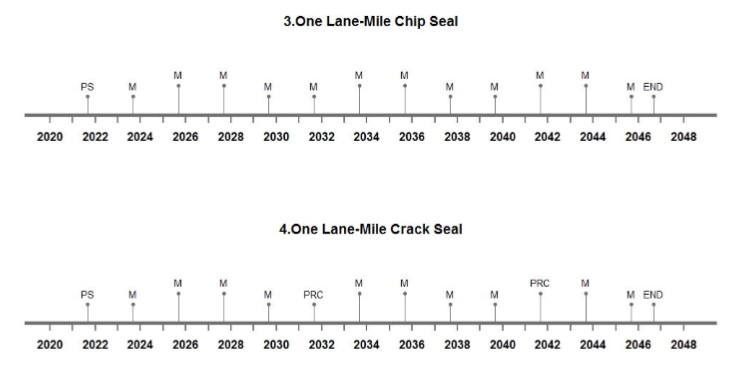
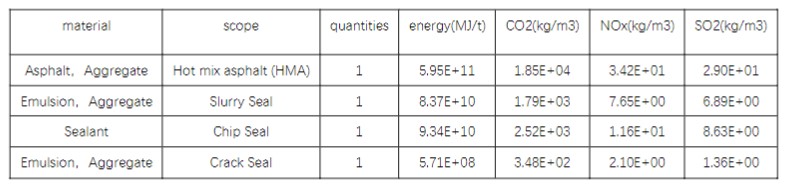
The design alternatives are as depicted below:
Life Cycle Timelines: In the road life cycle schedule, we assume that the road will be put into use on 01.01.2022, and its service life will be 25 years. In order for the road to achieving the expected service life, it is designed in the following four schemes to maintain the road, but each scheme also has its own life cycle. In order for each protective layer to normally play the role of protecting the road surface, the following interventions are required regularly.
- Repairs: RPA = 5 RPA –is the maintenance performed every 5 years
- Replacements: RPC = 10 RPC –is the maintenance performed every 10 years
- Maintenance: M = 2, M –is the maintenance performed every 2 years
Life Cycle Inventory:
The blow table depicts the Life Cycle Inventory of different materials, performance, and environmental indicators:
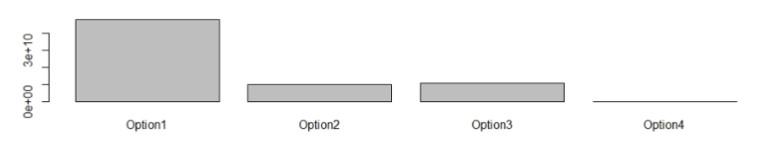
Bar plot showing energy consumption for design options
Radar Plot:
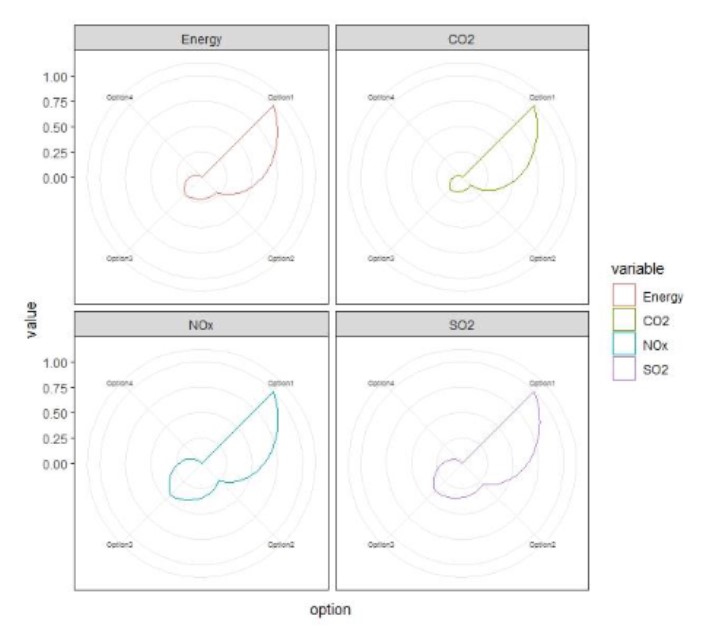
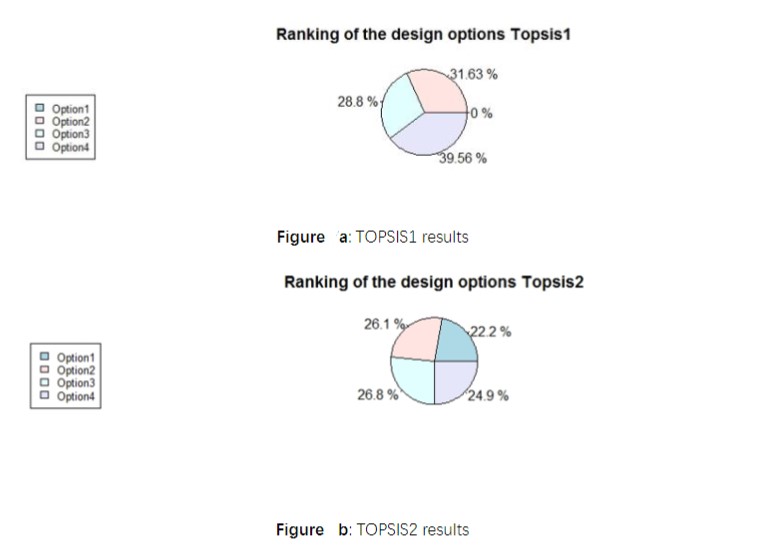
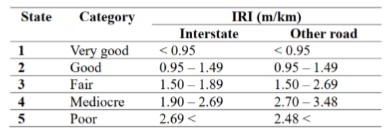
Multi-Criteria Decision Making: TOPSIS is based on the concept that the selected alternatives should have the shortest geometric distance from the positive ideal solution (PIS) and the longest geometric distance from the negative ideal solution. Figure a, Scheme 4 accounts for the largest proportion, reaching 39.56%, so the distance between Scheme 4 and the positive ideal solution is the shortest, and in Figure b, there is little difference among the proportions of the four schemes, which shows that the distances between the four schemes and the negative ideal value are almost the same. To sum up, Scheme 4 is more inclined to the positive ideal solution than the negative ideal solution, so Scheme 4 is the optimal solution.