Home / Group 2 / Integration context of the civil system / Drainage pipe
Introduction
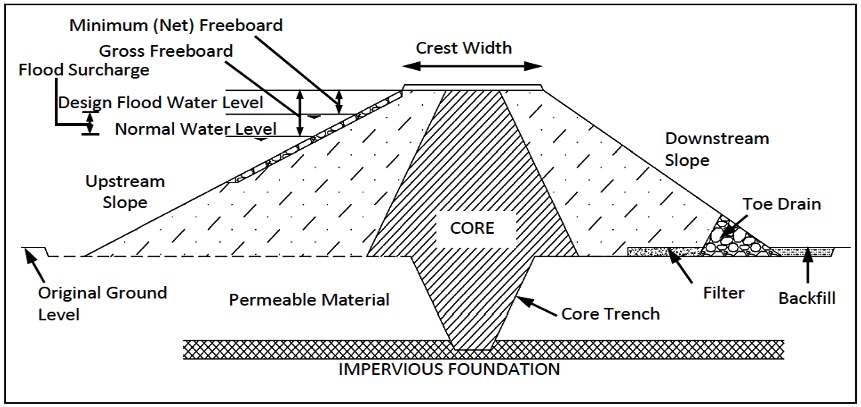
One of the key components in any embankment dam design is the toe drain system, which reduces pore pressures in the downstream face and toe of the embankment and conveys seepage away from the dam. Toe drains are typically located along the downstream toe of embankment dams to capture the seepage from the embankment, abutments, and foundation, and conveying it safely to a discharge area downstream. Figure 6 shows the sketch of the cross-section of Dam showing the location of the Toe Drain in the dam.
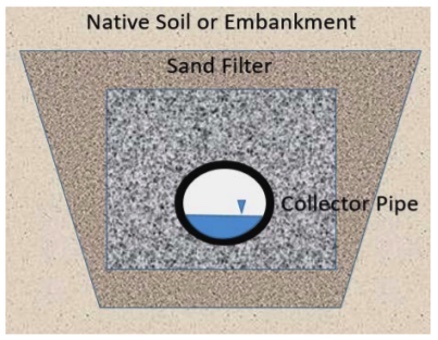
The Toe Drain system consists of Two-stage filters consisting of a fine-grained filter material surrounding a larger-diameter drainage material, which encloses the toe drain collection pipe. The Life Cycle analysis was conducted for 3 design options for the Drainage Pipe. The most suitable design option was decided on with the help of the Multi-Criteria Decision Method using the Analytical Hierarchy Process (AHP).
The most used materials for the drain pipe are Concrete, Vitrified Clay, PVC, HDPE, and Duct Iron. For the design Options, 3 drain collector pipes of 400mm diameter with different materials are chosen whose sketch is provided in Figure 4.
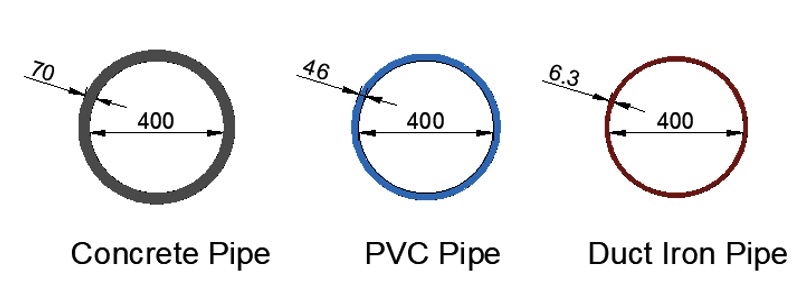
These materials were selected because they have comparable features in terms of quality and environmental characteristics. The pipes all have the same diameter but differ in their wall thickness and their constituent materials.
Goal & Scope
The goal of this LCA is to determine the total Resource depletion, Energy consumption, Cost, Global warming Potential (measured as CO2 equivalent), Acidification potential (measured as SOx equivalent), and the Eutrophication potential (measured as NOx potential) of the system from cradle to grave for the 3 design options, to make an informed decision to choose an alternative that has the lowest Carbon footprint and is economically viable. To do that, a system boundary is defined. The boundary consists of major flows contributing at different stages of the pipe lifecycle, which are raw material extraction, manufacturing of materials, construction, operation, and maintenance. It is to be noted that the Trenching and details of Filter material are not included in the scope of this LCA analysis.
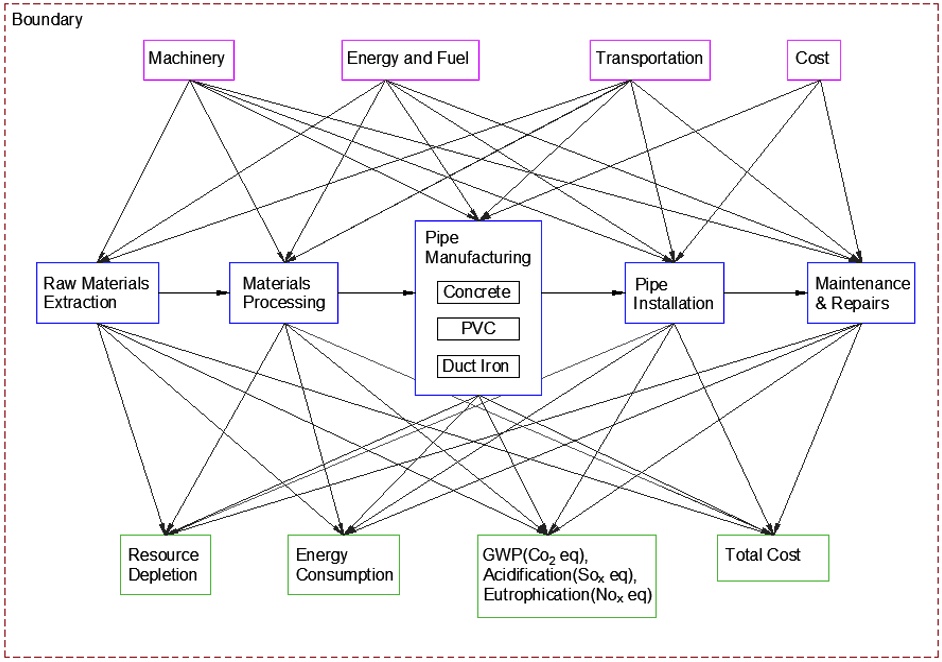
As seen from Figure 5 the processes involved in the lifetime of Pipe considered are the Manufacturing phase consisting of Raw materials extraction, processing, and Pipe manufacture; Construction phase consisting of Pipe installation and the Maintenance and repairs in the operation phase till the end of its lifespan. The inputs for all these processes are considered as the Energy and fuel consumption, the Machinery involved in the Transportation of materials, and the cost involved. At the end of this LCA analysis, we determine the total Resource consumed, the total energy consumed, total cost, and the emissions(CO2, SOx, NOx) till the end of Dam’s lifespan.
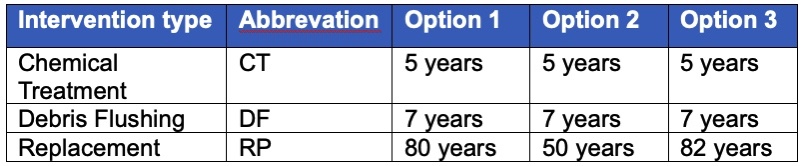
To this end, the total life span of each design option and the number of pre-defined interventions needed for each design option and their type are established as shown in Table 2. Irrespective of the design option, regular maintenance with Chemical treatment and Flushing of the debris is conducted every 5th and 7th year respectively. It can be also be noted that the life-span for each pipe is different and at the end of it, the pipe is replaced. The Life span of Dam is considered as 125 years.
Using the defined interventions, keeping pipe installations (PI) as the first event starting from 28.01.2021, timelines for each design option showing all the defined interventions were generated.
Life Cycle Cost Analysis
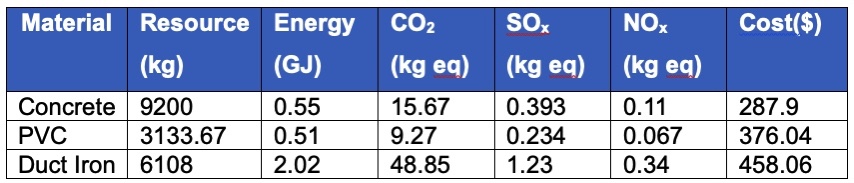
Following the Life Cycle Inventory, total Resource consumption, Energy Consumption, CO2, SOx, NOx emissions, and the total cost till the end of the lifetime for each option is calculated. To this end, first, the total length of the Pipe is calculated, which is the sum of Dam length and the conveyance to the outlet. The frequency of each type of intervention for all the design options is then calculated from the generated Timelines. Table 7 gives the values considered for 1m of dia pipe.
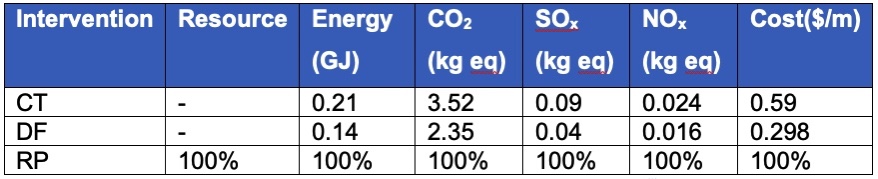
Along with these, Table 8 shows the values for each type of intervention. It can be seen that for the replacement of the pipe, all the values will be 100% of the previously defined value.
Multi-Criteria Decision Method
It is difficult to make an informed decision when each design option performs differently for each criterion. Therefore in this part, we adopt a Multi Criteria Decision Method using Analytical Hierarchy Method(AHP).
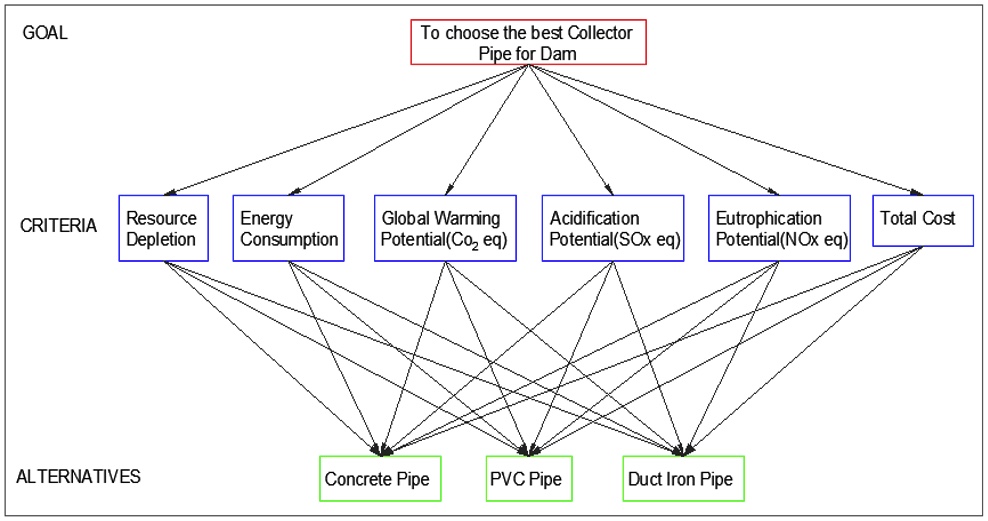
The Analytic Hierarchy Process (AHP) is a method for organizing and analyzing complex decisions, using math and psychology. It contains three parts: the ultimate goal or problem you’re trying to solve, all of the possible solutions, called alternatives, and the criteria you will judge the alternatives only. Figure 10 shows these three parts applied to the selected system.
The AHP uses linear algebra to assess the results of each pairwise comparison. Every criterion receives its own importance weight. The higher the weight, the more important the criterion is to the overall decision.
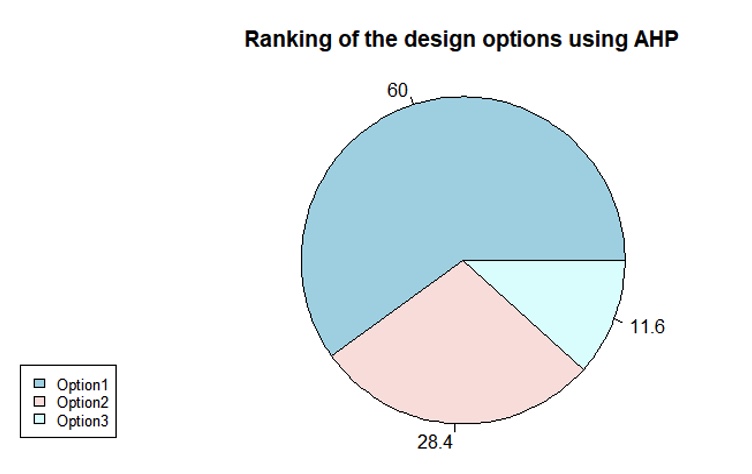
Th optimum design option that was determined with the help of the AHP method is presented in the figure below. It is clear to see that Option 1, the concrete pipe was the most suitable design option.