In our project, we have five different systems: timber and steel bridges, airport pavement, multistorey building and pv panels. Normally, for each of the named systems different maintenance events are planed with also different durations. To ensure maximum efficiency for users, maintenance works must be organized differently. The main goal is to maximize time between interventions and minimize the time the system or subsystems it not in use due to the interventions being in progress.
For developing a combined maintenance strategy we had to merge the maintenance strategies of our individual projects. The following figures represent the maintenance strategies of each individual project with the highest topsis ranking.
1. Individual Maintenance Strategies:
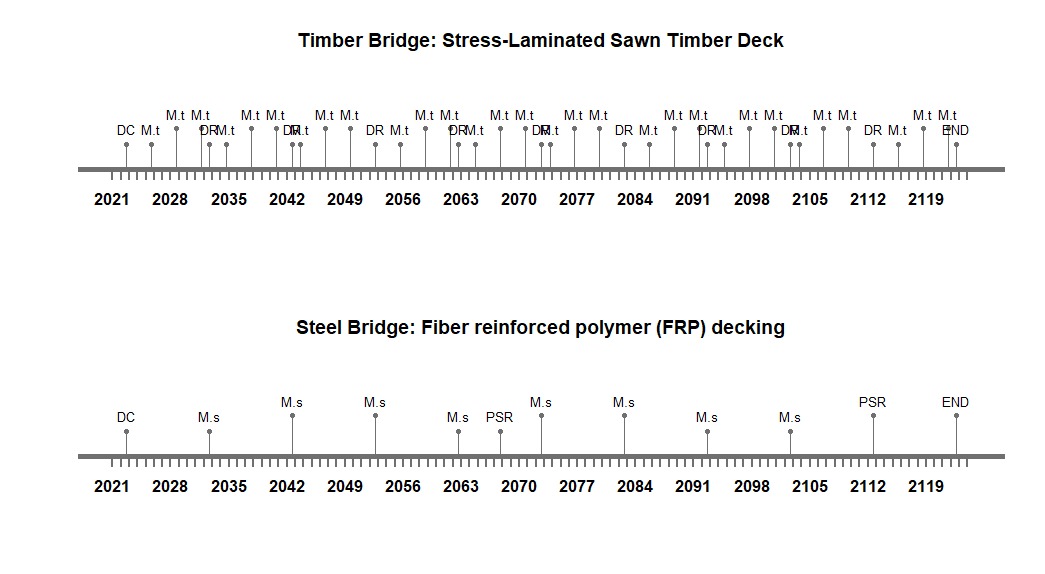
Steel Bridge
Timber Bridge
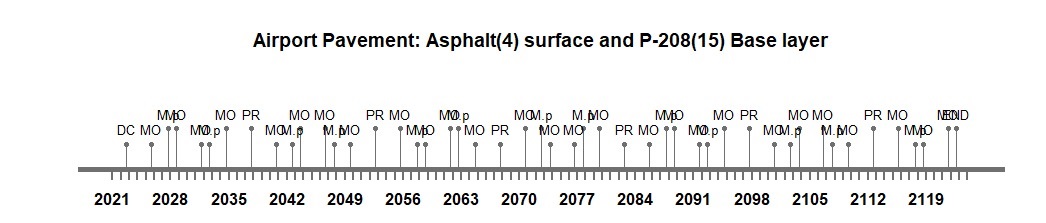
Airport Pavement
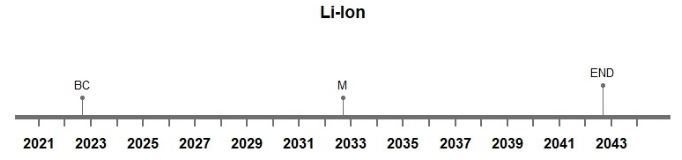
PV-Panels
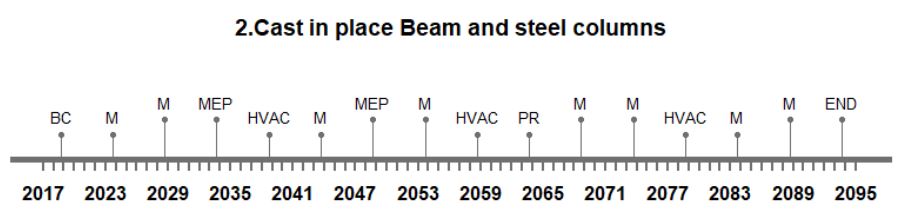
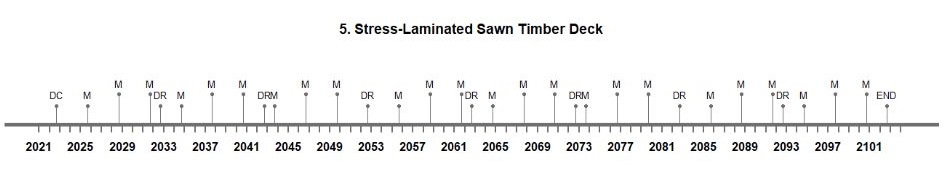
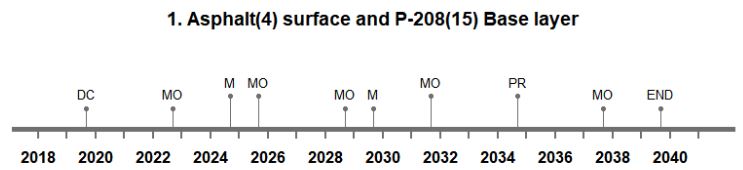
2. Integrated Maintenance Strategies:
Within the integration process we had to adjust the different lifetime assumptions for our individual projects and assumed a lifetime for the integrated civil system of a hundred years, as can seen in the figures below.

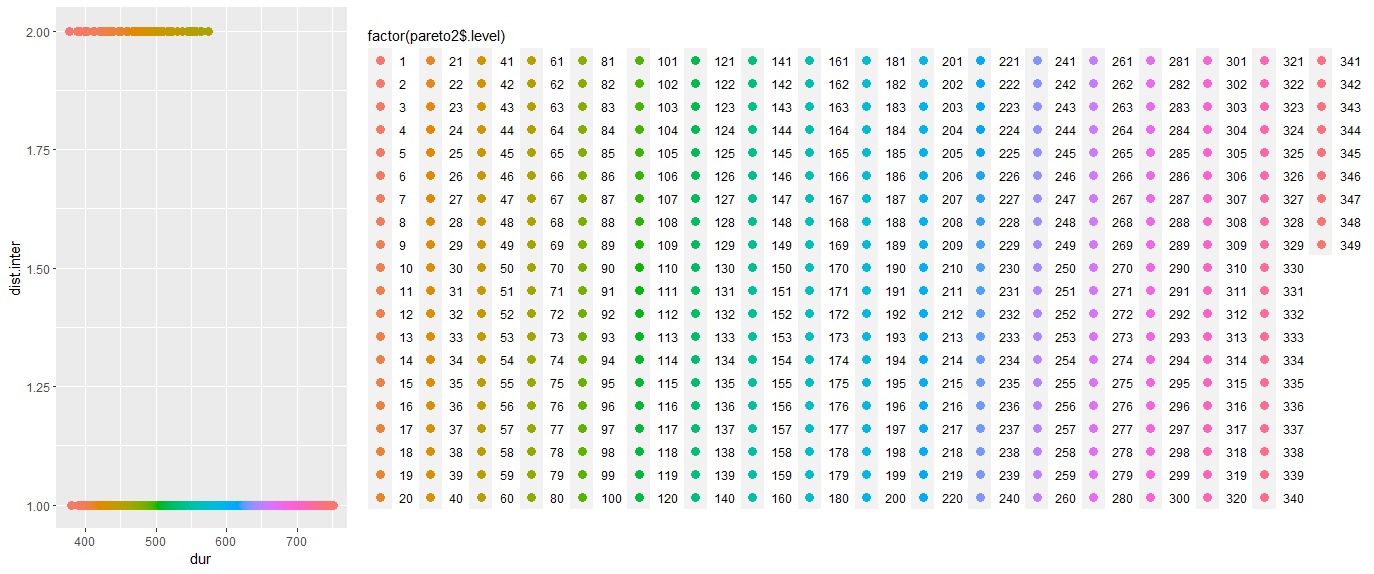
3. Intervention Matrix Scenarios:
The result is as shown in figure below. In this figure the alternatives we explored are ranked based on the defined preference. These are presented as 349 groups. On the left side of the figure we can see all 349 groups divided by the distance of interventions by years over the duration in minutes. The most optimal alternatives are those having less duration and greater distance between each consecutive intervention. It is evident from the Pareto graph that the upper left part, which are colored in orange are the most optimal alternatives.