Engineering Challenge – Maintenance Strategy
It is easy to imagine the logistic and financial risk associated with maintaining and and monitoring a system that is offshore. For that reason, a important part of this project is the integration of four separate maintenance strategies to provide for am optimized plan that covers all of the integrated systems. The first step is to hold a round table discussion where the main tasks and concerns are discussed for the individual systems. It is at this stage where we can see that the individual systems require slightly different approaches to their strategies depending on the nature of the system, and it also depends on the scaling the modeler show to develop the plan.
One critical thing that all systems share in common is that visual inspections, checks and routine maintenance is primarily performed underwater. So in order to provide a better maintenance plan, checks should be synchronized to minimized the frequency of required maintenance on the system. Furthermore, because the integrated system provides energy for homes it is an important part of the engineering challenge to limit the duration that the maintenance tasks take place and the time that the energy systems need to be turned off to do so.
Approach
The events and specific duration of each event are modelled for each of the four individual systems. The frequency and duration for the requirements are based on the research for each of the individual systems. It was reasonable to a plan a total lifespan of 25-30 years for the integrated systems because that is about the extent of the individual systems. Below the four individual systems are modelled for the maintenance strategies after having an open table discussion about what types of maintenance needed to be performed and how often it could reasonably be implemented. As seen below different timelines have different kinds of maintenance performed as seen with the different abbreviations below over the 30 year life span.
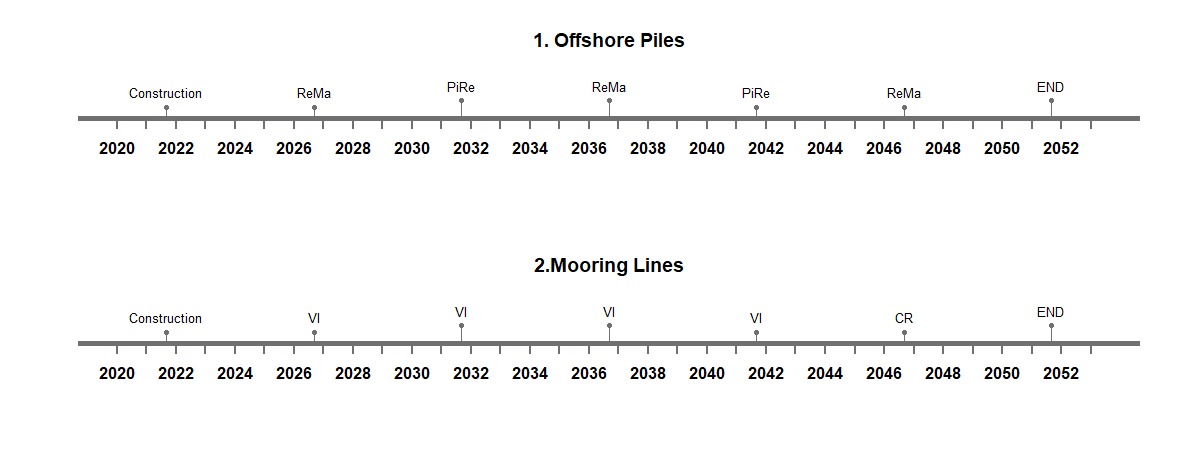
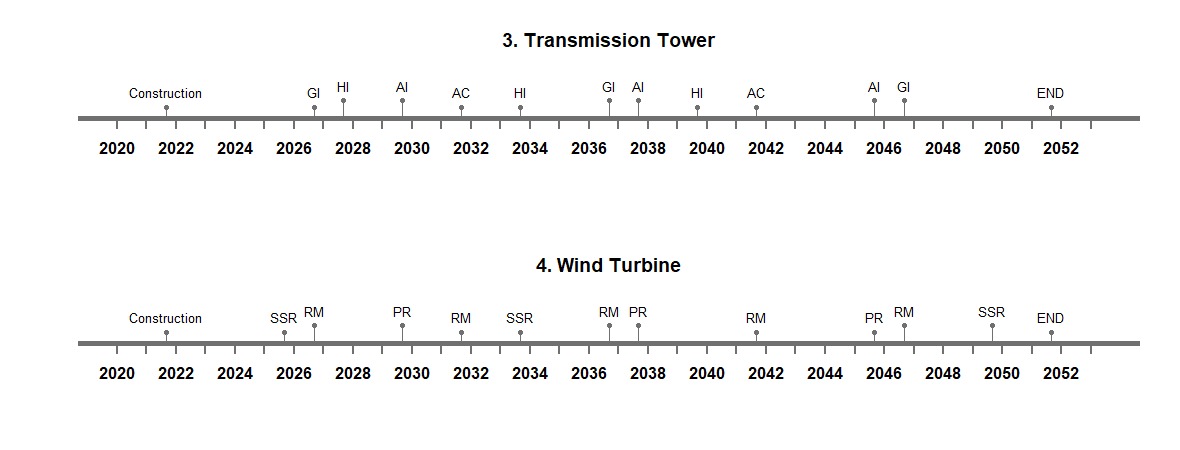
Figure 1: New Maintenance Timelines
Model
The model create hypothetical maintenance scenarios based on a combination of all four individual systems and distributed generated for the maintenance events. During the background research, tolerable and plausible ranges for how often event should and can take place, and when developing the model we used this knowledge and an engineer’s perspective to experiment with the parameters until we came up with results that we are satisfied with. The model creates a hypothetical maintenance scenario based on the automation of two or more systems with all of these calculations performed by the computer. A total duration of interventions of 119 days during the set lifetime were computed after combining all the four systems.. This means that there is a relative overlap of maintenance strategies of the individual systems. Our system proposed 119 days of maintenance during its lifespan.
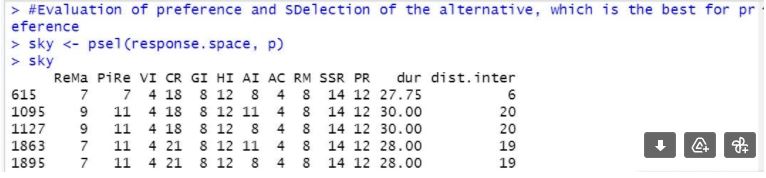
Figure 2 Repairs/Maintenance strategy
However, as engineers it was important to take the time to develop plausible and rational intervention matrixes based on our background research, which is essentially the input for the model. We did so in a round table discussion, giving each other insights and feedback. The model carried out is than used to minimize the duration of interruptions and maximize the time between maintenance needs to be performed in the integrated system. The results are visualized for the classification of the maintenance are below.
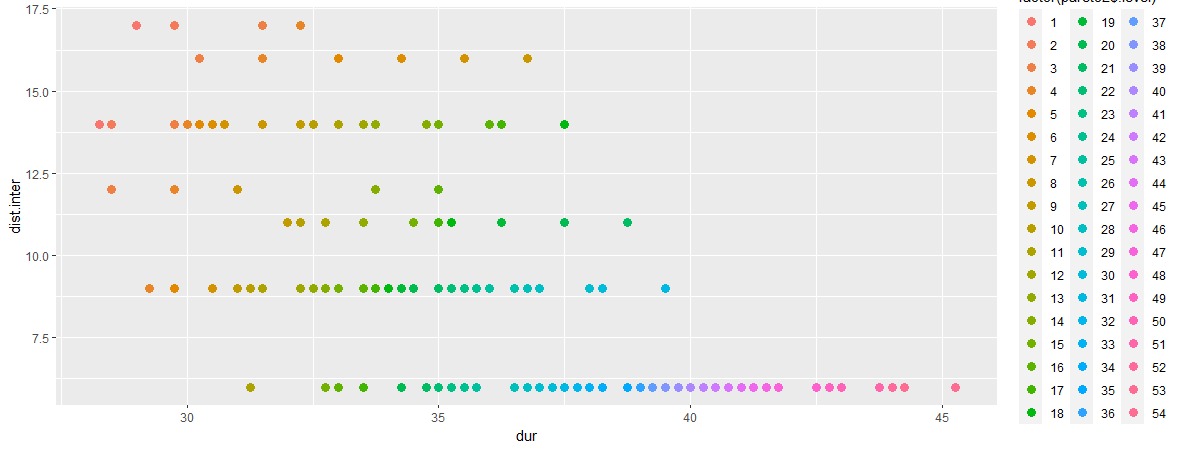
Figure 3 Classification of Model Results
Results
The best solution alternatives can be seen below and the pareto frontier is used to show the best s solutions based on our preferences. As discussed early, these are that the intervention is short and that the maximum avaible time between interventions is used. The pareto frontier is show in blue and the best design solutions are shown black. In conclusion, the best solutions would allow for interventions only every 14-16 years and take only but 20-20 days according to the results. These are feasible findings.
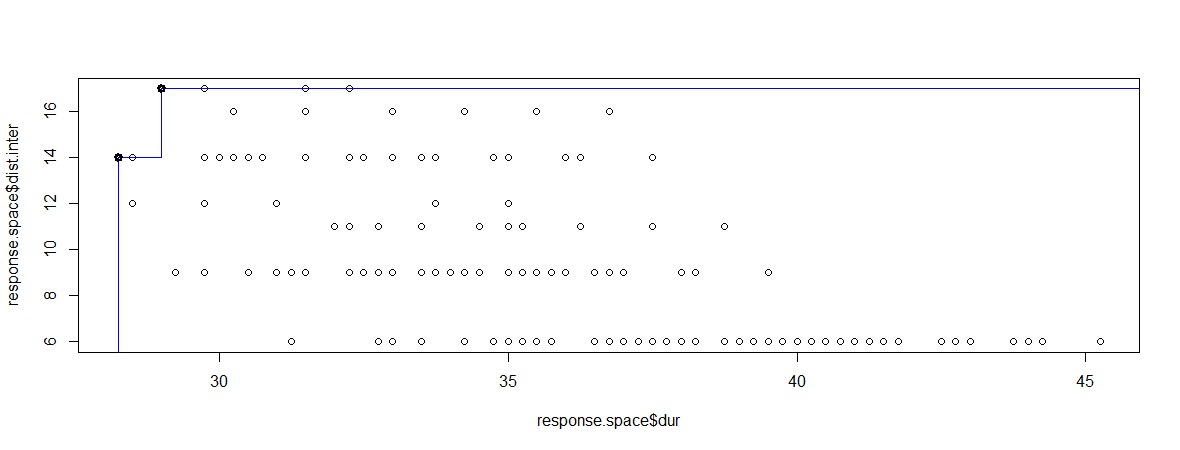
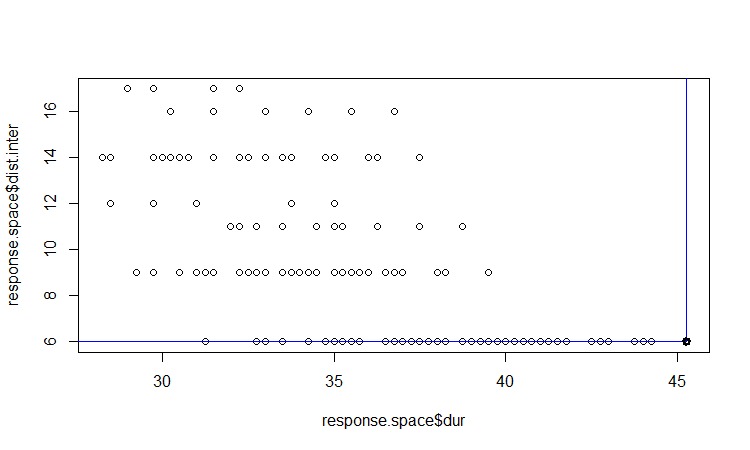
Figure 4 Pareto Frontier of Results