1. Introduction
Du to the rapid progression of climate change the importance of sustainable solutions in construction has increased significantly in the past years (Zorster 2023). This trend is also perceivable for the construction of office buildings(Krebs 2024). Not only a companies’ employees but also their customers value sustainability and environmental consciousness which is one reason why sustainable office buildings have become a competitive advantage(Krebs 2024). Building facades can contribute to a more sustainable office building in two ways. Firstly, by insulating the building and therefore decreasing its energy demand. Secondly, by having a design that causes as little greenhouse gas emissions as possible. This project aims at determining a façade option that meets the requirements of a thermal envelope in terms of the U-value and accounts for the least greenhouse gas emissions.
2. Methodology
In order to do so, the emissions for three different façade designs provided by a construction company are compared throughout their life cycle conducting a life-cycle analysis (LCA). For this LCA four different stages of the lifecycle are considered as shown in figure 1.
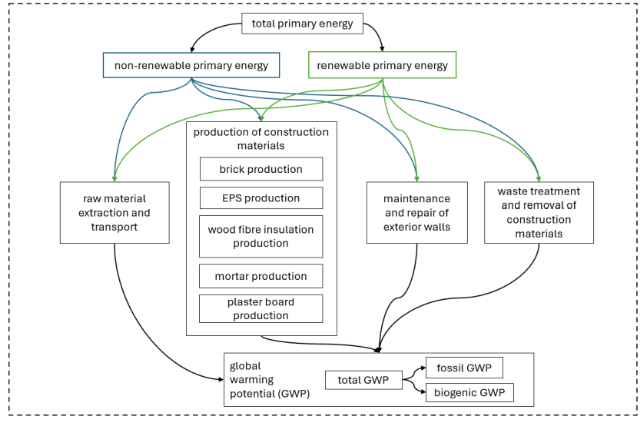
Figure 1
Four indicators are used to determine the option with the least greenhouse gas emissions. For the energy consumption the subdivision into non-renewable and renewable energy is interesting since only the first one causes the emission of greenhouse gases. The use of renewable energy leads to a reduction of non-renewable energy consumption. The fossil GWP is an indicator for the amount of greenhouse gases released into the atmosphere. On the other hand, the biogenic GWP measures the emissions stored within materials, so it leads to a reduction of greenhouse gases in the atmosphere. Therefore, the values are negative. The LCA is used to determine the value of all the indicators for every material and design option throughout all four lifecycle stages.
Based on the LCA an analytic hierarchy process (AHP) is used to determine the most suitable option. AHP is a multi-criteria decision-making method (Demir u. a. 2024) which facilitates the comparison of the performance of the design options in different criteria according to rated pairwise comparison.
2.1. Design Options and Lifecycle Inventory
In this project three different design option for the façade of an office building are explored. All of the design options are designed to have the same U-value of 0.221 W/(m²K) which lies below the limit U-value for non-residential buildings of 0.24 W/(m²K) („Anlage 7 GEG – Einzelnorm“ 2020). Therefore, the amount of heating energy needed is the same for all design options. The U-values were calculated based on („DIN 4108-4 2017-03“, 2013.) and („DIN EN ISO 10456 2010-05 Wärme-und feuchtetechnische Eigenschaften“, o. J.).
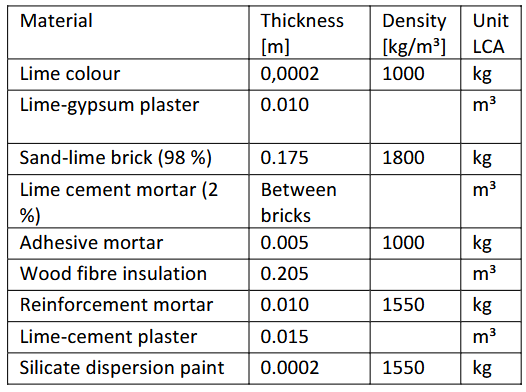
The first design option is a usual exterior insulation finishing system with EPS insulation (EIFS 1). This is commonly used design in office buildings especially because EPS is the cheapest insulation material (energie-experten 2024).
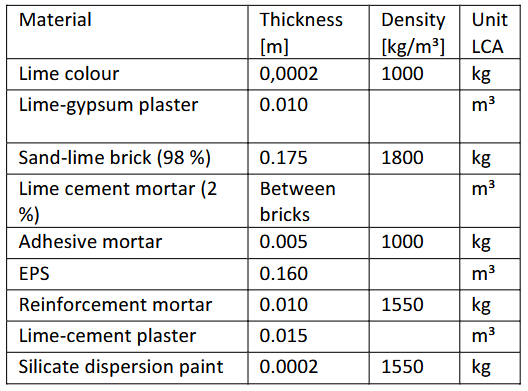
Table 1
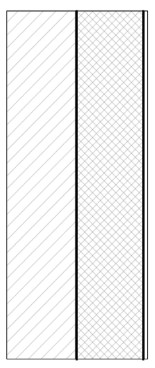
Figure 1
The second option is also an exterior insulation finishing system but with wood fibre insulation instead of EPS (EIFS 2):
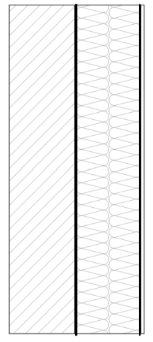
Figure 2
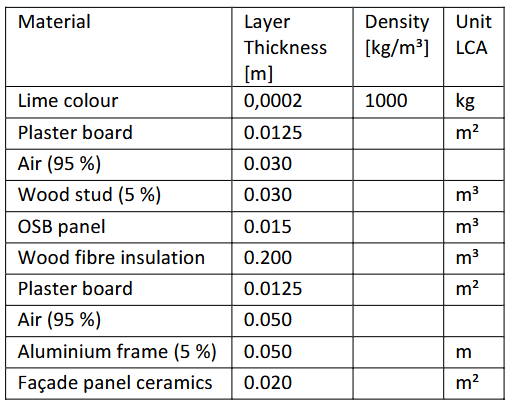
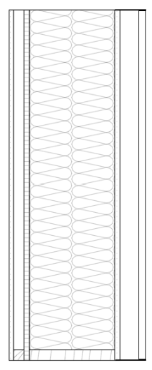
The third option examined in this project is a wooden stud wall with wood fibre insulation and a ceramic panel façade as a ventilated curtain wall (VCW):
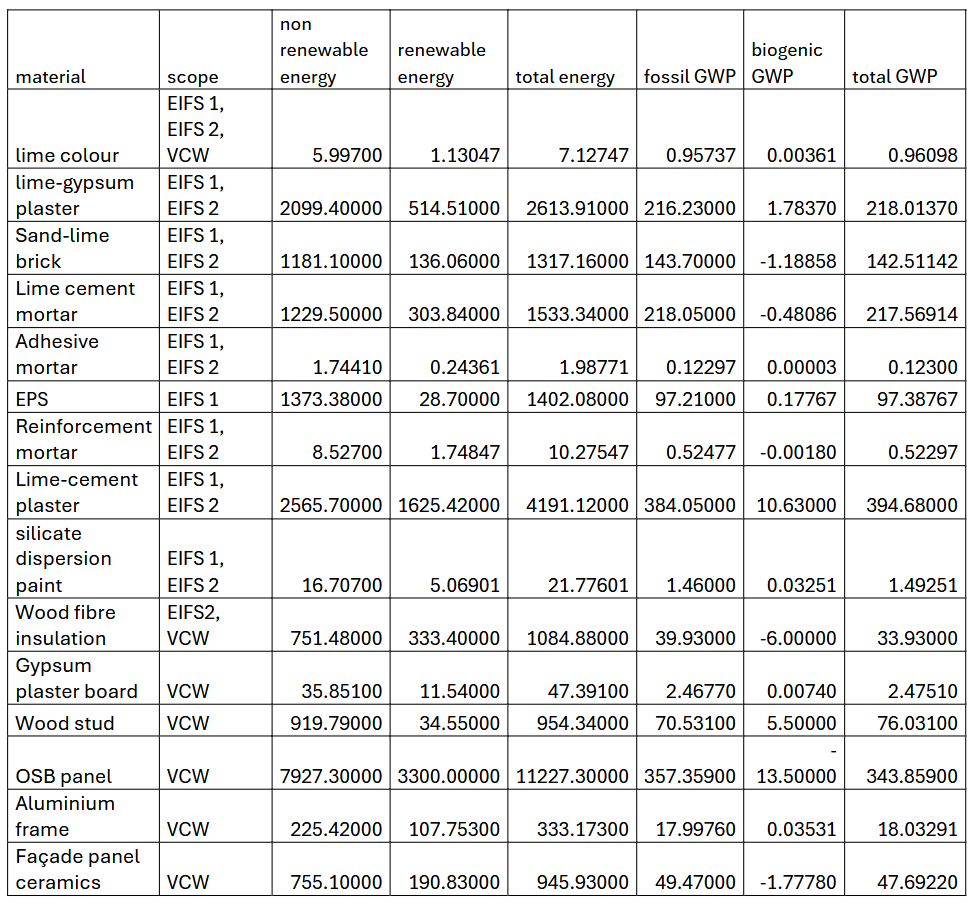
Table 4 shows the life cycle inventory for all materials for the selected indicators. The data was collected using the database “ökobaudat”. This platform is provided by the federal ministry for living, urban development and construction. All the data complies with DIN EN 15804+A2 (Bundesministerium für Wohnen, Stadtentwicklung und Bauwesen 2024).
The link to the datasets used for every material are given in the appendix. The LCI does not include the maintenance.
2.2. Maintenance
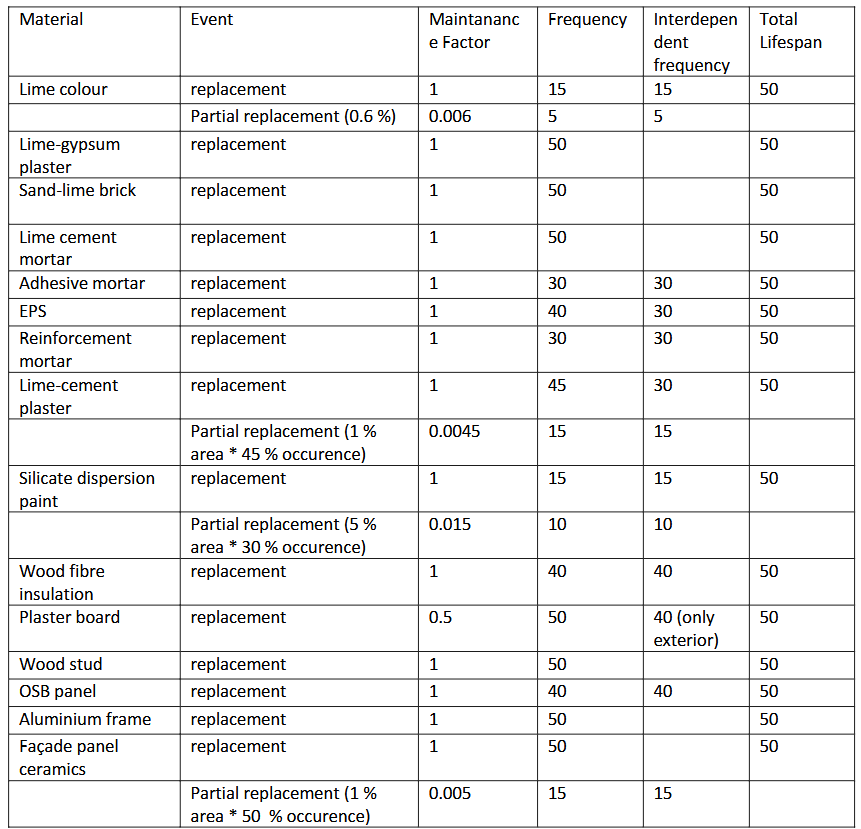
The main maintenance plan (table 5) is developed based on the service life data according to the rating system for sustainable construction “BNB” („BNB Nutzungsdauern von Bauteilen 2017-02-24“) as well as from (Madureira u. a. 2017). Some material layers have a higher lifespan but need to be exchanged earlier because the materials underneath need to be exchanged. This is represented by the factor “Inderdependent frequency”.
In general, the exchange of a material means that the values for the other three lifecycle stages must be doubled since the new material needs to be produced and the old needs to be removed. For the partial replacement only a percentage of the material needs to be removed and produced which is why the maintenance factor is introduced. The amount of material needed for the partial replacement is determined through the multiplication of the affected area percentage times the occurrence probability of the damage. The probability for the ceramic façade is taken from (Silvestre und De Brito 2011), for the silicate dispersion paint from(Costa u. a. 2014) and for the lime-cement plaster from (Flores-Colen, De Brito, und De Freitas 2008).
3. Life-Cycle Analysis (LCA)
3.1. Model
The LCA for each design option is determined using vector and matrix calculation. The material amount is determined by multiplying a vector with the layer thickness by a vector with a factor, e.g. the density, which transforms the amount into the unit required for the LCI. Then the number of interventions is calculated dividing the maintenance frequency vector by the total lifespan of the façade. Afterwards the material amount vector is multiplied by the intervention vector and the LCI vectors for each LCA indicator. Finally, the values of all materials are summed up to achieve the total value of the indicator for each design option.
3.2. Results
Energy consumption
Figure 5 shows the total amount of energy consumption. The diagram clearly shows that the VCW has a significantly higher energy consumption than both EIFS. While 1371 MJ are necessary to produce 1 m² of VCW the EIFS2 with the wood fibre insulation requires only 926 MJ/m² which is slightly less than the EIFS1 with a consumption of 928 MJ/m².
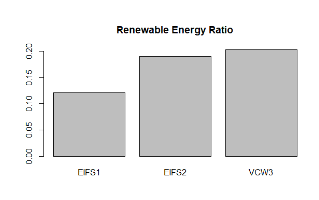
Comparing the non-renewable energy consumption for the design option a similar distribution becomes apparent (figure 6). The difference is that the deviation of the non-renewable energy consumption between EIFS 1 with a value of 816 MJ/m² and EIFS 2 with a value of 751 MJ/m² is slightly bigger. In comparison to the amount of non-renewable energy consumed, the amount of renewable energy is significantly smaller (figure 7). With a value of 278 MJ/m² the VCW uses the most renewable energy followed by EIFS 2 with 176 MJ/m² and the EIFS1 with 112 MJ m². Although the difference between the EIFS options in the total energy demand is comparably small the values for their renewable energy consumption are clearly distinct. This is also evident from the distribution of renewable energy ratio of the total energy consumption (figure 8). While for EIFS 1 12.07 % and for EIFS 2 18.99 % of the total energy demand is met by renewable energy. VCW achieves a percentage of 20.26 %.
Global Warming Potential (GWP)
The results for the GWP are similar to the results for the energy consumption (figure 9).
Figure 9 Figure 10 Figure 11
EIFS 1 has the highest total GWP with a value of 80.3 kgCO2-Äq/m² (figure 9). The GWP of EIFS is slightly lower with a value of 72.9 kgCO2-Äq/m² and the VCW has the lowest GWP of 68.1 kgCO2-Äq/m². Looking at the fossil GWP in figure 10 it becomes apparent that the distribution for the fossil and the total GWP are very similar. The values have a maximum deviation of 4 % which is reached by the VCW. The VCW also has the highest biogenic GWP with a value of -3.15 kgCO2-Äq/m² which is more than double the biogenic GWP of EIFS 2 (figure 11). EIFS 1 has a biogenic GWP of only -0.16 kgCO2-Äq/m². In general, the biogenic GWP of the design options is much smaller in comparison to the fossil GWP.
3.3. Discussion
The results of the LCA indicate that the EIFS options are clearly favourable in terms of energy use. Indeed, in comparison to the EIFS the VCW has a significantly higher percentage of renewable energy used throughout the facade’s lifecycle which means that no greenhouse gas emissions occur due to that type of energy consumption. But the non-renewable energy demand which does contribute to greenhouse gas emissions remains much higher than for the EIFS options anyway. Therefore, VCW is the least favourable option in order to achieve the goal of reducing greenhouse gas emissions.
Looking at the LCI a possible explanation for the much higher consumption of non-renewable energy of the VCW could be the high energy demand for the OSB panel. In comparison to the other materials, it is significantly higher. Although the panel only has a thickness of 1.5 cm this also accounts for the energy intensive materials in the other design options such as the lime-gypsum plaster and the lime-cement plaster. Also, the OSB panel only has a lifespan of 40 years and needs to be exchanged once during the lifecycle of the façade resulting in the double non-renewable energy consumption. Therefore, it is probably the reason for the high energy demand of the VCW. Especially considering, that all the other materials used for the VCW require much less energy. But it also shows that there is a clear potential for improvement. In further research engineers can investigate the reason for the high demand of non-renewable energy and either reduce the energy needed or try to replace it by renewable energy.
Since EIFS 2 has a similar total energy consumption as EIFS 1 but allows the use of more renewable energy coming along with a lower demand of fossil energy along the façade´s lifecycle it is the best option. Figure X also reveals that the percentage of renewable energy use in relation to the total energy demand is only slightly smaller for EIFS 2 than for the VCW which has the highest percentage. This also supports the eligibility of the EIFS 2. For the fossil GWP VCW performs best. It accounts for the lowest emission of greenhouse gases in comparison to the other design alternatives. Considering that this option mainly consists of organic material this is sensible. According to the LCI the highest GWP for the VCW is caused by the OSB panel.
But the lime-cement plaster in the EIFS options which has the same thickness asl the OSB panel already has a higher GWP. Therefore, the results are comprehensible.
The high percentage of wood in the VCW façade option also explains its higher biogenic GWP. In fact, the values for the biogenic GWP might seem very small at first considering so much wood. The cause for that is the consideration of waste treatment and removal within the boundaries of the LCA which lead to a release of most of the stored CO2.
After the VCW EIF2 performs second best in both fossil and biogenic GWP. Considering that the only difference between both EIFS options is the use of wood fibre insulation instead of EPS the insulation has a high influence on the greenhouse gas emissions of a façade. As the results demonstrate the deviation between the fossil GWP of EIFS2 and EIFS 1 is even bigger than between EIFS 2 and VCW. The gravity of the influence of the wood fibre insulation becomes also apparent due to the energy indicators. Although the overall energy demand is similar, wood fibre insulation can use a much larger ratio of renewable energy.
In summary, EIFS 2 always performs better than EIFS 1. It is the best choice in terms of non-renewable energy and the second-best choice for the other indicators. EIFS 1 is the second-best option for fossil energy consumption but the worst for all the other indicators. The VCW consumes a lot of non-renewable energy but also the highest amount of renewable energy. Moreover, it has the lowest fossil and highest biogenic GWP. While EIFS 1 is clearly the least favourable option the best option can not be determined without rating the indicators.
This is why the author develops a MCDM model using the AHP to facilitate the identification of the best design option to achieve the goal of determining the façade with the least greenhouse gas emissions based on the results and considerations above.
4. Analytical Hierarchy Process (AHP)
Model
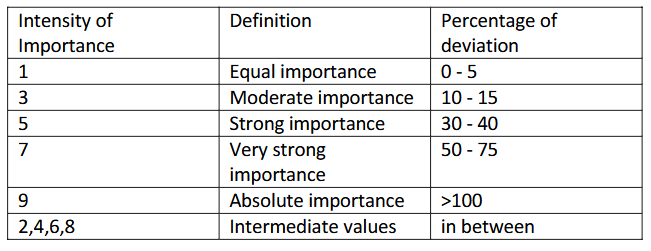
For assigning weights to the indicators the AHP a method for multi criteria decision making is used. First a pairwise comparison of the different options is made for each indicator. The rating scale shown in table 6 is adapted from (Marceau, Nisbet, und VanGeem 2007). Based on the results of the LCA the pairwise comparison is derived. The author developed a key to decide which intensity (case) is chosen for which level of deviation between two values as indicated by the percentages.
This leads to the following matrices:
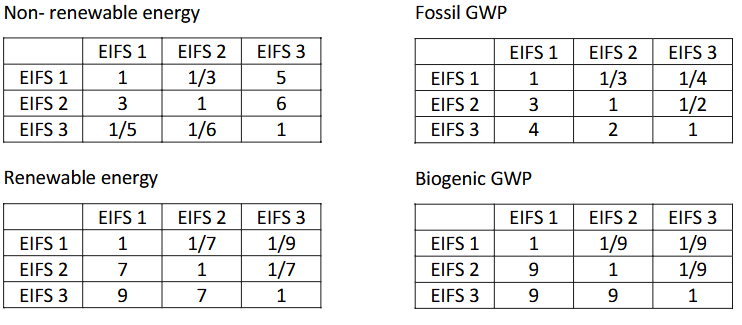
The eigenvectors of this matrices are used to calculate the weights of the criteria.
Furthermore, a matrix with a pairwise comparison of the indicators is created. The fact that the VCW achieves the lowest fossil GWP although it consumes by far the most non-renewable energy shows that energy consumption is not the most influential parameter causing greenhouse gas emissions in a façade lifecycle. On the other hand, the OSB panel having the highest GWP although consisting of wood in the VCW indicates that it is still relevant for some materials. This is why non-renewable energy is considered the second most influential parameter in this model. The biogenic GWP reduces the total GWP, but the values are rather small. Therefore, it is rated as third influential parameter. Finally, the renewable energy consumption only influences the greenhouse gas emissions indirectly when reducing the non-renewable energy consumption. But, as the results for VCW proof, a high amount of renewable energy does not necessarily come together with a low amount of non-renewable energy, so it is considered least influential. The resulting matrix for pairwise comparison is presented in table 7.
Results and Discussion
The AHP model produces a ranking of the design options which is displayed in figure 12.
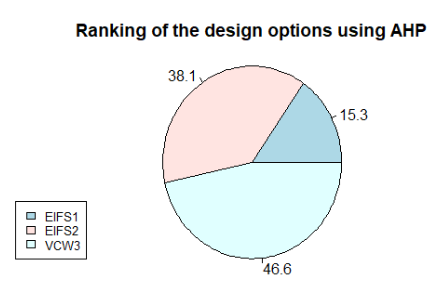
Figure 12
EIFS 1 only scores 15.3 % which is significantly less than the other two options. Therefore, the results from the AHP confirm the judgement based on the LCA which considers EIFS 1 to be the worst option.
According to the pie chart the VCW has the highest level of indicators. Given that the author chooses the fossil GWP to be the most important indicator this is comprehensive. Given the overall good performance of EIFS 2 it makes sense that it also achieves a high percentage which is only 8.5 % less than the VCW. In fact, the author considers non-renewable energy which is the best indicator for EIFS 2 the second-most important indicator since it is a huge contributor to the GWP as stated above. The GWP is rated only “more important” than non-renewable energy.
The advantage of the EIFS 2 being only moderately worse than the VCW is that it could also be a good option if a brick wall is required, or a wooden wall is not possible for some reason. Also, the EIFS 2 being a much better option than EIFS 1 shows that renovation with wood fibre insulation is much better in terms of greenhouse gas emissions than EPS.
In summary, the results from the AHP are comprehensive. In order to build a façade with as little greenhouse gas emissions as possible an engineer should choose the wood wall with the wood fibre insulation and the VCW structure. But one has to be aware that this model only accounts for these three options. There might be other design options with much better performance.
Moreover, there are only four indicators considered in this model. In real-life there are many more factors apart from the GWP which must be considered for the decision about a façade design such as optical preferences. Or more importantly price. Especially, for office buildings the price of a façade option is a very important decision-making criterion. Furthermore, there might be technological or statical constraints.
It must also be noted that the AHP is extremely sensitive towards the rating for the pairwis comparison. Different engineers might propose different ratings which could completely change the outcome. Furthermore, the pairwise comparison rating for the indicators is based on the results of the LCA. These again depend on the data chosen for the LCI. The data used for this model is taken from the database “ökobaudat” which contains data that is officially accepted by the German certifiers.
However, most data were chosen from generic or average data sets. In reality the values might be completely different depending on the manufacturer. Especially the amount of renewable energy used, or recycling products differs among manufacturers. Moreover, the datasets account for Germany. For other countries the data is likely to be different as well.
5. Conclusion and Limitations
The model consisting of an LCA and an AHP produces comprehensive results. Design option 3, a ventilated curtain wall consisting of a wooden stud wall with wood fibre insulation and ceramic façade panels, is the option producing the lowest greenhouse gas emissions. This can be explained by its high percentage of organic materials. For the same reason the exterior insulation finishing system with wood fibre insulation does already have a huge impact reducing the greenhouse gas emissions for a façade design in comparison with a usual one with EPS insulation. All three options were designed to have the same U-value which meets the German requirement for office buildings set in the GEG. In conclusion, the model creates a good basis for engineers to choose the best design option for office buildings with this design goal in Germany.
However, the model is limited on three different design options. There might be various design options which perform even better. Also, the goal of this model is narrowed down to reducing the greenhouse gas emissions. In order for the model to be applicable in projects with a broader field of requirements engineers should extend the model by important indicators such as cost. Another interesting addition would be including the recycling potential.
Since the rating for the pairwise comparison of indicators and design options has a high level of individuality engineers might want to adjust it when applying the model. It must be also noted that the LCI and maintenance plan is based on average and generic data from Germany which is why the model only accounts for Germany. Moreover, it can make sense to exchange generic or average data with specific manufacturer data if a specific manufacturer is known to be used. Also, data as for example the amount o renewable energy used is time dependant. A few years from now the amount could have increased significantly.
In the end it is questionable if analysing the indicators non-renewable and renewable energy consumption is necessary for choosing the option with the least greenhouse gas emissions since the GWP is a specific indicator for that and already includes emissions from energy consumption. However, including them gives engineers, including those who work in industry, the opportunity to understand the relation between those types of energies and the GWP and identify points for improvement on the system or even the component level.
Therefore, the model does not only present a reliable comparison of three design options for office building facades in terms of greenhouse gas emissions but also contributes the possibility of further examination and optimization of the individual design options with this goal.
6. Bibliography
„Anlage 7 GEG – Einzelnorm“. 2020. 2020. https://www.gesetze-im-internet.de/geg/anlage_7.html.
„BNB Nutzungsdauern von Bauteilen 2017-02-24“. o. J.
Bundesministerium für Wohnen, Stadtentwicklung und Bauwesen. 2024. „Suche | Datenbank | ÖKOBAUDAT“. ökobaudat. 2. Oktober 2024. https://www.oekobaudat.de/no_cache/datenbank/suche.html.
Costa, Jorge, P. V. Paulo, F. A. Branco, und J. De Brito. 2014. „Modeling Evolution of Stains Caused by Collection of Dirt in Old Building Facades“. Journal of Performance of Constructed Facilities 28 (2): 264–71. https://doi.org/10.1061/(ASCE)CF.1943-5509.0000417.
Demir, Abdullah, Ali Ersin Dinçer, Cihan Çiftçi, Sedat Gülçimen, Nigmet Uzal, und Kutay Yılmaz. 2024. „Wind Farm Site Selection Using GIS-Based Multicriteria Analysis with Life Cycle Assessment Integration“. Earth Science Informatics 17 (2): 1591–1608. https://doi.org/10.1007/s12145-024-01227-4.
„DIN 4108-4 2017-03“. o. J.
„DIN EN ISO 10456 2010-05 Wärme-und feuchtetechnische Eigenschaften“. o. J.
energie-experten. 2024. „WDVS-Kosten: Preise, m2-Kosten & Amortisation“. energie-experten. 2. September 2024. https://www.energie-experten.org/bauen-und-sanieren/daemmung/wdvs/kosten.
Flores-Colen, Inês, Jorge De Brito, und Vasco P. De Freitas. 2008. „Stains in Facades’ Rendering – Diagnosis and Maintenance Techniques’ Classification“. Construction and Building Materials 22 (3): 211–21. https://doi.org/10.1016/j.conbuildmat.2006.08.023.
Krebs, Matthias. 2024. „Nachhaltige Büros: Ein wachsender Trend für eine zukunftsfähige Immobilienwirtschaft | Brandenburgische Ingenieurkammer“. 15. November 2024. https://www.bbik.de/artikel/nachhaltige-bueros-ein-wachsender-trend-fuer-eine-zukunftsfaehige-immobilienwirtschaft/, https://www.bbik.de/artikel/nachhaltige-bueros-ein-wachsender-trend-fuer-eine-zukunftsfaehige-immobilienwirtschaft/.
Madureira, Sara, Inês Flores-Colen, Jorge De Brito, und Clara Pereira. 2017. „Maintenance Planning of Facades in Current Buildings“. Construction and Building Materials 147 (August):790–802. https://doi.org/10.1016/j.conbuildmat.2017.04.195.
Marceau, Medgar L, Michael A Nisbet, und Martha G VanGeem. 2007. „Life Cycle Inventory of Portland Cement Concrete“.
Silvestre, J.D., und J. De Brito. 2011. „Ceramic Tiling in Building Façades: Inspection and Pathological Characterization Using an Expert System“. Construction and Building Materials 25 (4): 1560–71. https://doi.org/10.1016/j.conbuildmat.2010.09.039.
Zorster, Hermann. 2023. „Green Buildings: Nachhaltiges Bauen auf dem Vormarsch | BNP Paribas Real Estate“. 20. April 2023. https://www.realestate.bnpparibas.de/blog/esg/green-buildings-nachhaltiges-bauen-auf-dem-vormarsch.
7. Acknowledgements
Chat GPT was used to assist in simplifying the code and to refine some formulations.
| Main Page | Introduction | Integration Context of the Civil Systems | Maintenance Strategies | Life Cycle Analysis | Multi-Objective Optimization |
