Life Cycle Analysis
Introduction
After having established an optimal maintenance strategy regarding the downtime and infrequency of maintenance activities, however the environmental impact as well as the resources used have not been considered.
In order to assess the impact of the maintenance strategies on the primary energy use, the global warming potential as well as the monetary cost throughout the lifetime of the campus, a life cycle analysis according to EN 15978 will be done, for a system lifespan of 50a.
The Procedure
For this the codes of the individual systems were integrated into one and the data collected adapted to the common LCA scope and boundaries.
-
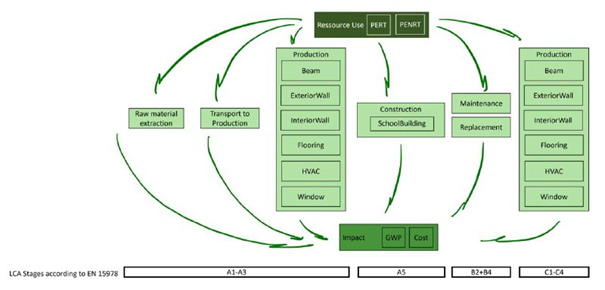
Fig. 1: Scope and Boundaries School LCA
The materials used in not needed design options were excluded, and positions for each maintenance activity affecting the subsystem introduced (in flooring example: “Pavement Markings” and “Routine Maintenance”). It is assumed that the interventions affect only the cost unless new material is introduced to the system.
-
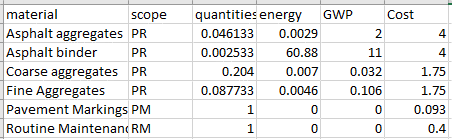
Fig. 2: Example Flooring – LCI.materials
0. For the whole system initially defined are variables for the number of times a certain event occurs and the measurements of the school building
-
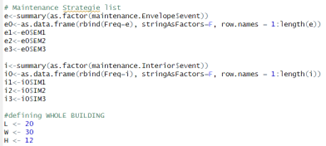
Fig. 3: Setting global variable
Next for each subsystem the following is done.
1. The adapted material data base is read.
-
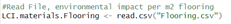
Fig. 4: Example Flooring – Read File
2. The amount of material for each subsystem is defined, according to the general measurements of the building (Length, Width, Height).
-

Fig. 5: Example Flooring – Calculate Mass
3. A data frame is made for each material/ scope (depending on subsystem), with the columns (material, scope, quantities, energy, GWP, Cost, interventions).
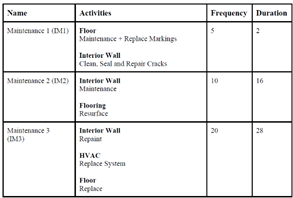
The interventions are the number of times a maintenance event occurs, affecting the specific position. If an intervention leads to a new production of material, then “1” is added to the intervention, to account for the initial production.
-
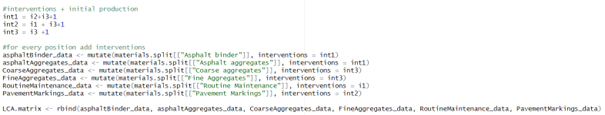
Fig.6: Example Flooring – Number of interventions
For reference, the interior maintenance activities established previously.
- The data frame is expanded with the columns (materials.LC, energy.LC, GWP.LC, Cost.LC)
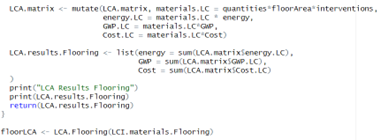
At this point, the amount of each position throughout the entire lifetime is calculated (in this example), which combined with the quantity per m2 of flooring and the indicators per m3 of each position.
- All sub element LCAs are combined into one matrix.
The LCA.results lists where combined into one matrix, adding a row for the sum of total Energy, GWP and Cost of the School.
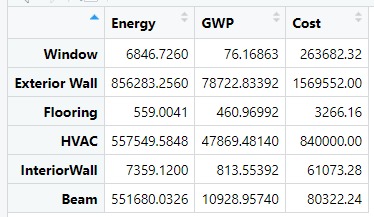
When looking at the energy consumption, it sees as though the exterior wall, due to its mass, combined with its frequency of replacement accounts for the most energy for production, construction, maintenance, replacement and end of life. The HVAC system is a close second, due to the materials (mostly metal) used and its relatively short lifespan also rather energy intensive. Because of its low energy per m2, the Flooring demands the least amount of energy throughout the systems lifetime.
Looking at the GWP a similar pattern arises, which makes sense considering that the energy required for producing each subsystem majorly is produced by non-renewables, according to their databases’, which leads to greenhouse gas emissions.
Also the cost of the Exterior wall turns out to be the highest, due to the high cost of repair and replacement per m2, this time followed by the windows, which face many maintenance actions, each with their price.