Introduction
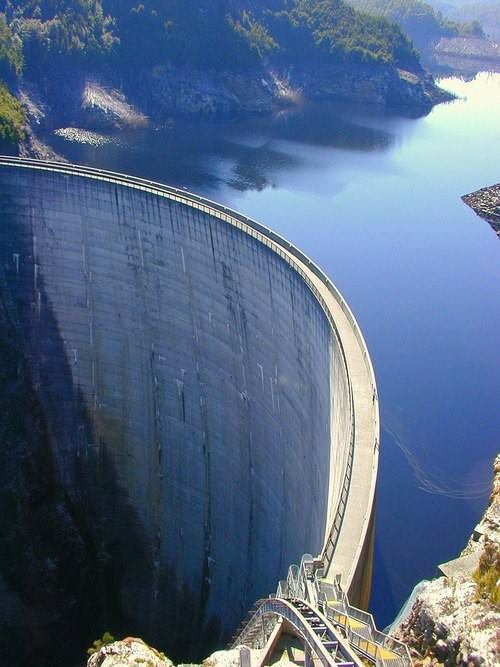
Fig: Overview of a Dam
An arch dam is a concrete dam with a plan that curves upstream. The arch dam is constructed so that the force of the water against it, known as hydrostatic pressure, forces against it, straightening the arch and strengthening the structure as it pushes into its base or abutments. External loadings fluctuate over time, and severe environments wreak havoc on arch dams’ physical qualities. Damage to such dams increases over time, and concrete disintegration is unavoidable. A model for modeling concrete degradation due to chemomechanical damage is proposed. There are a number of causes of failure of a Dam. One of the most common reasons for dam failure is excessive water intake caused by prolonged rains and flooding. Although most dams are built to withstand extreme weather, prolonged periods of rain and flooding can put undue strain on the construction, causing it to fail. The instability of the structure may not be recognized in soil research, which is another important cause of arch dam failure. Penstock vibration causes the structure to crack. The contraction joints’ grouting activity is insufficient, resulting in fissures in the structure.
The dam is definitely a complex product to understand its working. There are several kinds of dams based on different functions. Through life cycle analysis we are able to determine and analyze the possibilities of failure as well as the timeline to maintain it.
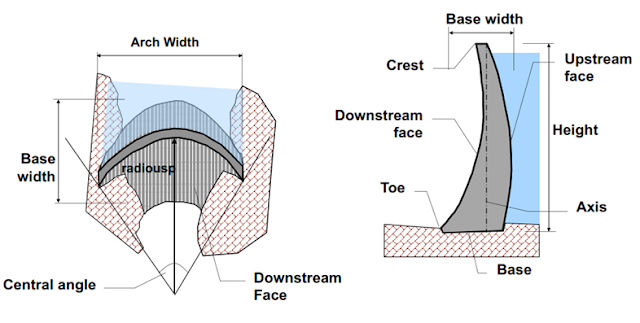
Fig: Schematics of an Arch Dam
Goals
The engineering design challenges of the dam include Stress and stability analysis of dam foundations under external loads, earthquake behavior of dam–foundation–reservoir systems, mechanical properties of mass concrete for dams, high-velocity flow, and energy dissipation for high dams, and technical problems of hydropower plants and underground structures. The ultimate aim to take the dam as a system was to classify failure possibilities, Maintenance possibilities and to give a clear idea of the working of the system. Through different analytical methods, we were able to achieve the objective to be met.
Materials and Design Options
I have taken 3 different options as given below:
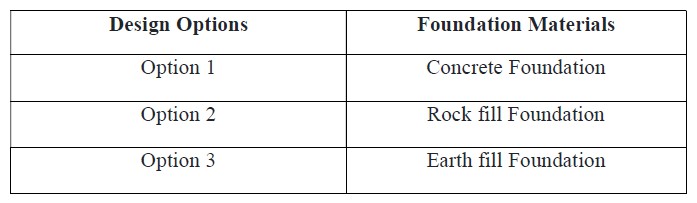
For the value inputs, I took some values including the cross-sectional areas of the Concrete foundation as 67.45 m2, the cross-sectional area of Rockfill Foundation as 134.81 m2 and the cross-sectional area of the Earth fill foundation as 101.17 m2. Another input of values for different aspects of materials was also included. Some of these values are assumed.
Life Cycle Time Line
The average life span of an Arch Dam is 100 years to 120 years. But the life cycle of a dam can be 100 years with regular maintenance and several inspections on time in order to prevent the damage. In this case, there can be 3 event options with 3 design options including different interventions for maintenance (M) and seepage check (SC). As the subsystem selected was the foundation, the three options are taken were taken to find the life cycle time of concrete foundation, rockfill foundation and earth fill foundation.
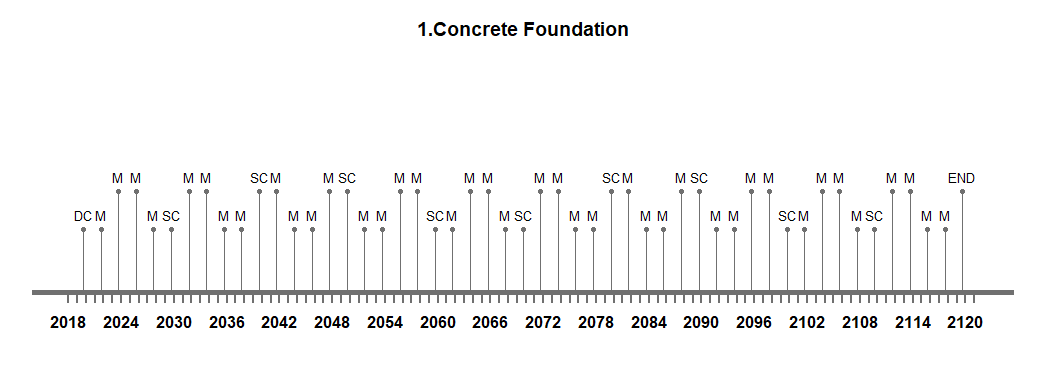
Fig: Timeline of Concrete Foundation
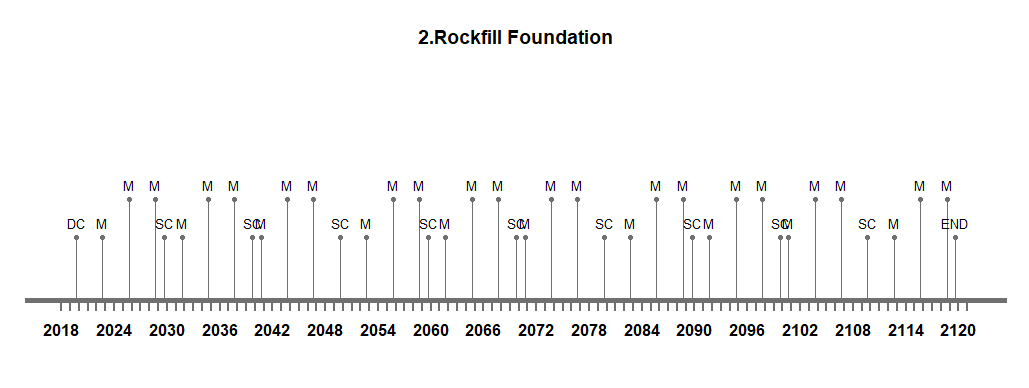
Fig: Timeline of Rockfill Foundation
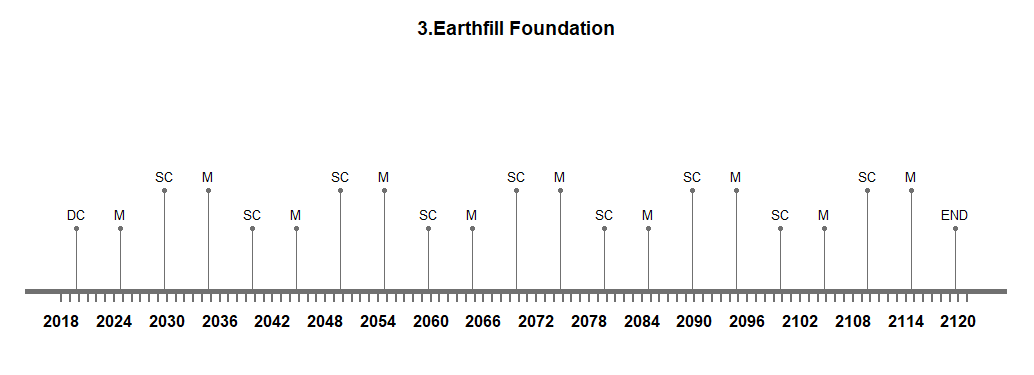
Fig: Timeline of Earthfill Foundation
Life Cycle Inventory and Analysis
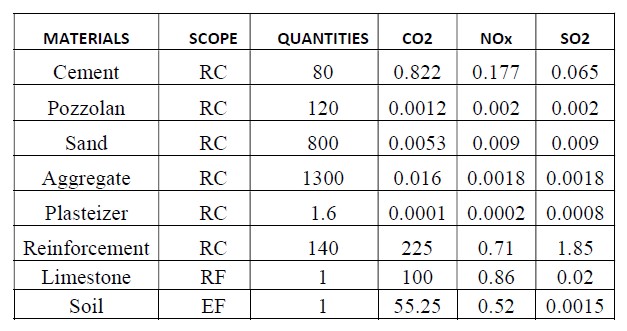
All resources used to produce the product, such as energy, water, raw materials, and processed materials, as well as all substances released into the environment, such as pollutant emissions into the air, soil, and water, and losses resulting from the product’s production and consumption, are identified and quantified in a life cycle inventory analysis. Here we can analyze the emission of the carbon footprint of the selected sub-system with respect to different design options. Based on the analysis performed, it can be seen that when it comes to concrete foundation the emission of carbon is more than that of any design options. A significant rise in values can be found in rockfill and earth fill.
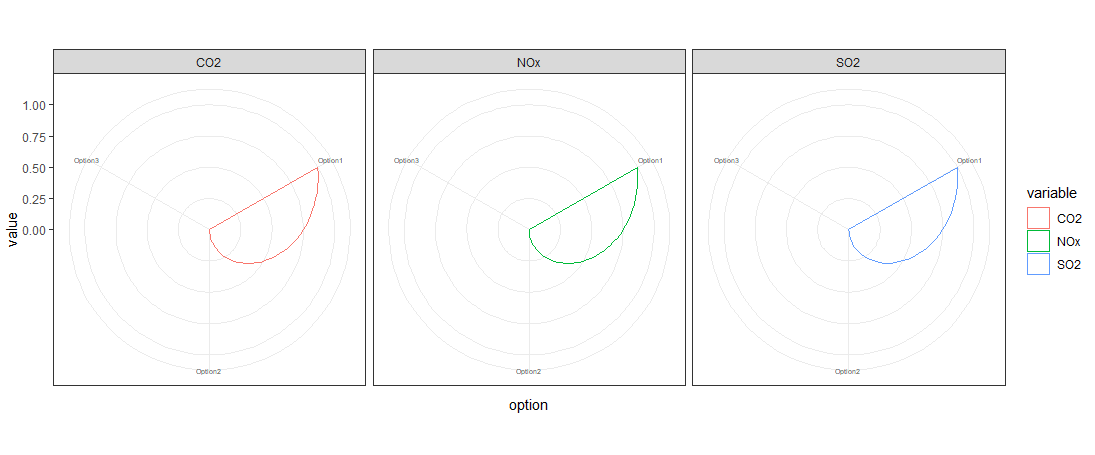
Fig: Radar Plot of the performance indicators
AHP and TOPSIS
The Analytic Hierarchy Process (AHP) is a method for organizing and analyzing complex decisions, using math and psychology. AHP provides a rational framework for a needed decision by quantifying its criteria and alternative options, and for relating those elements to the overall goal. Here for each criterion, we define matrix with alternative length as values for 3 categories: CO2, NOx, and SO2.
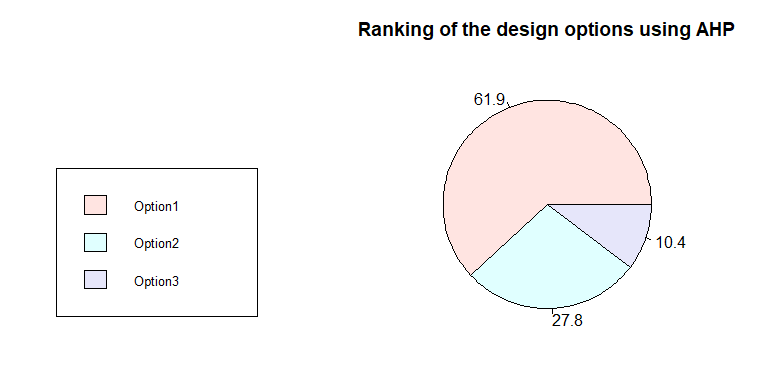
Fig: AHP result in a pie chart
TOPSIS is a useful technique in dealing with multi-attribute or multi-criteria decision-making problems in the real world. It compares a set of alternatives based on a pre-specified criterion. The method is used every time we need to make an analytical decision based on collected data. Here we define the weightage of all the criteria with minimum or maximum value, and with the positive ideal solution and negative ideal solution.
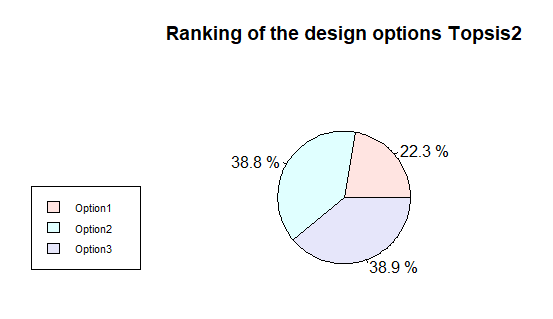
Fig: TOPSIS result
References
1.https://www.ukessays.com/essays/environmental-sciences/a-life-cycleanalysis-of-a-dam-environmental-sciences-essay.php
2. Life Cycle Analysis with Multi-Criteria Decision Making: A review of approaches for the sustainability evaluation of renewable energy technologies
Author links open overlay panelVerónicaCampos-GuzmánaM. SocorroGarcía-CáscalesaNievesEspinosabAntonioUrbinaa
3. https://constructionheadline.com/mix-rcc/
4. The Analytic Hierarchy Process-What It Is And How It Is Used – R. W. Saaty