RISK-BASED ASSESSMENT & SYSTEMS CONDITIONS.
The ultimate aim of Risk-Based Assessment is to understand how the states of the chosen system change during the lifetime, which are the possible ways the chosen system can degrade and/or fail as well as the factors leading to degradation and failure by building a statistical Markov Chain Model. Analysis of possible failure modes of chosen system and its components by creating a fault tree. It also includes the determination of Mean Time to Failure (MTTF) and Mean Time to Repair (MTTR) along with the calculation of Value of Information.
The below table represents the possible states of a Rigid Pavement during its lifetime:
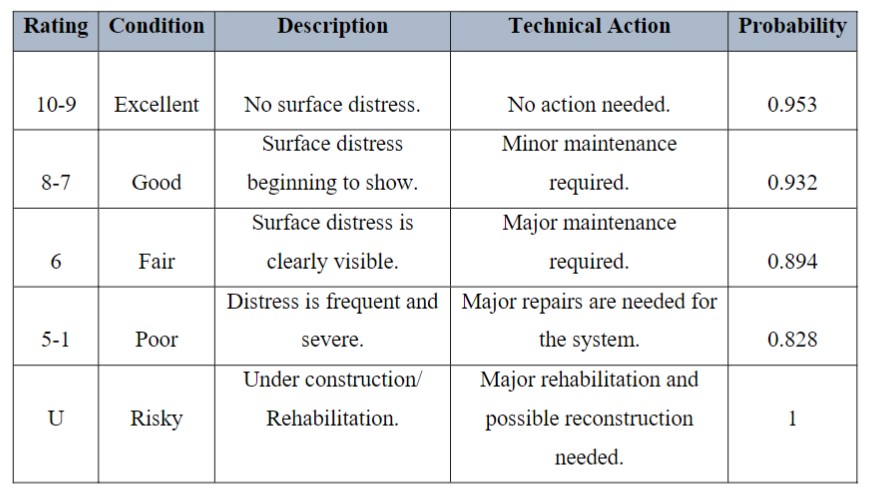
From this Risk-based analysis, it can be seen that developing a model for Rigid pavement deterioration over its lifetime can be of significant help when commissioning a pavement. As in this analysis, the pavement has been modeled for deterioration during a lifetime, during an event of Failure including repairs, the Engineers and Managers are able to approximately predict the behavior of pavements during its lifetime and they can plan the Monitoring, Maintenance, and Repair schedule better with this Risk-based analysis including predicted Mean time to Failure as well as Repair values. The Value of Information can also be calculated based on different scenarios which help them to come up with better alternatives for repairs and maintenance.
LIFE CYCLE ASSESSMENT.
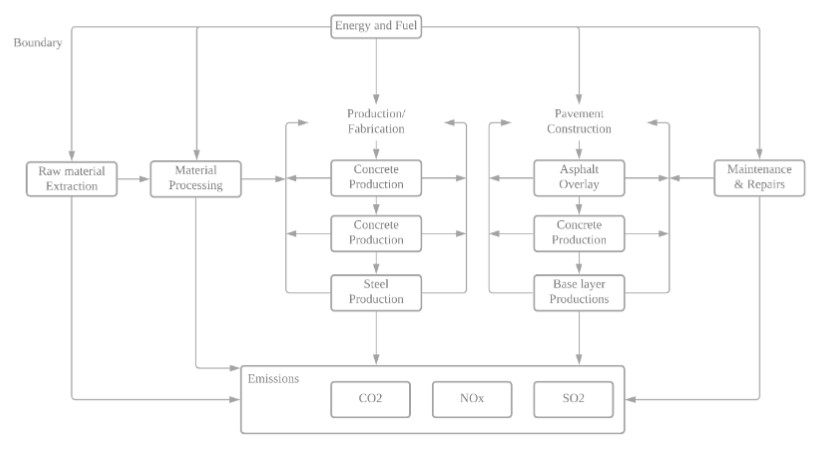
The ultimate aim of this assessment is to define the parameters which are needed to roughly calculate the materials, quantities and to define the scope and goal of the life-cycle analysis. By establishing a life cycle inventory, identification of the materials of the subsystem is carried out and the amount of each material of the subsystem, as well the number of materials consumed during the life cycle is calculated.
The below figure represents the scope and the boundaries of the assessment.
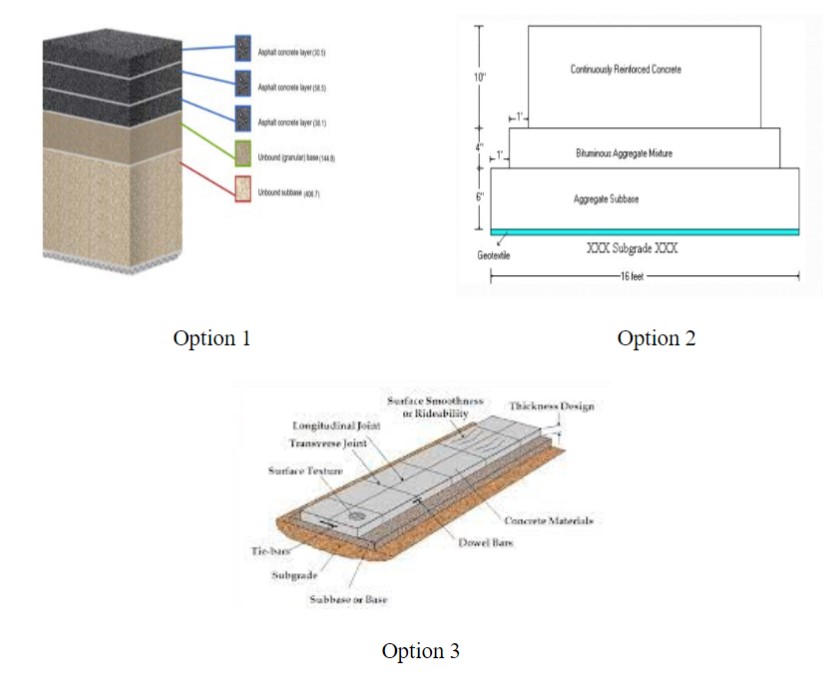
The design alternatives are as depicted below in the diagram:
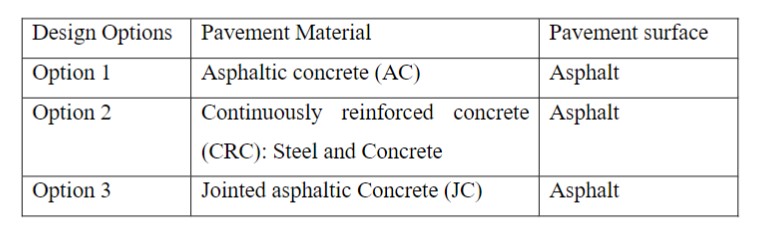
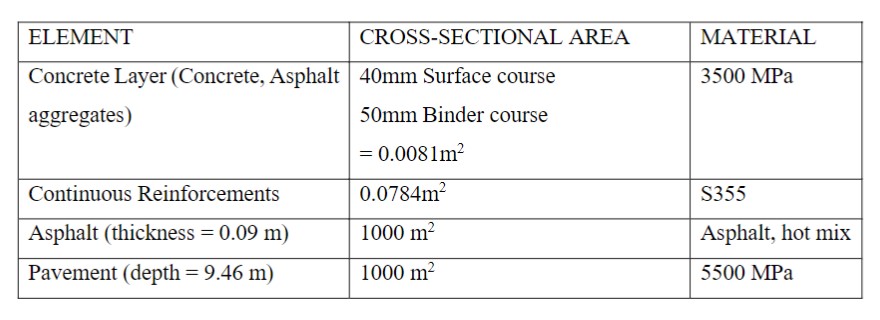
The below table represents the materials used under analysis for the system:
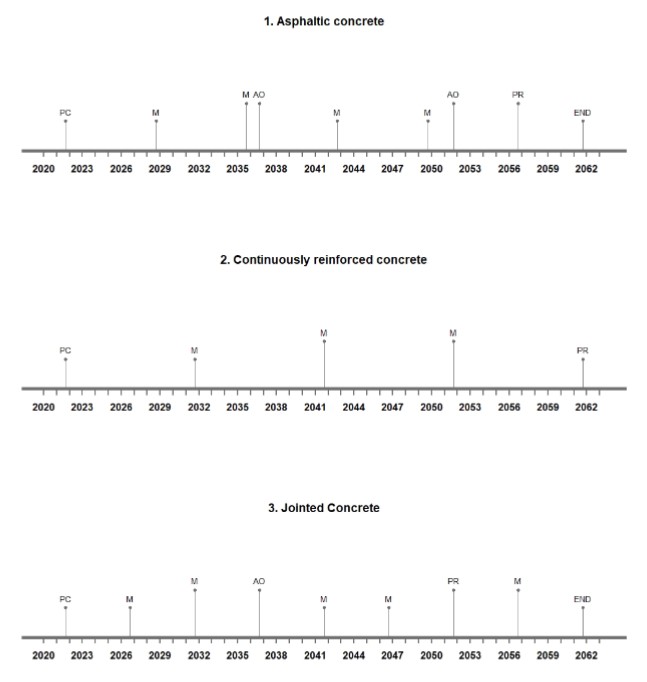
Life Cycle Timeline: The below following plots represent the timeline of three different types of concrete slabs which are used in the construction of the road pavement namely, Asphaltic concrete, Continuously Reinforced concrete, and Jointed concrete. The Life-Cycle period of the pavement lifetime generally is expected to be 40 years. The plots have notations marked at particular intervals of years which are AO, PC, M, PR, and END. AO stands for Asphalt Overlay, PC stands for initial Pavement Construction, M stands for Maintenance, END stands for End of Life-Cycle, and similarly, PR stands for Pavement Replacement. Asphalt Overlay (AO) is generally carried out every 15 years for every pavement that requires an asphaltic overlay that represents the partial replacement of the pavement. The maintenance period generally varies from 5 – 10 years hence the frequency of this event occurring is greater than compared to the rest of the events and much importance needs to be given as a designer since this event causes the increase in the cost variations. Pavement Replacement (PR) is an event with the occurrence of a lower frequency that represents the intervention undertaken for generally from 20 – 30years; compared to this, M is an event with high frequency as stated, which means that every 5 years maintenance is conducted. The start date of analysis, which is 2022-01-11, with a lifetime period of 40 years, which are similar for all design options, the name of the design options, interventions, and the frequency of the events are pointed using the R function “timelineS” data frame package.
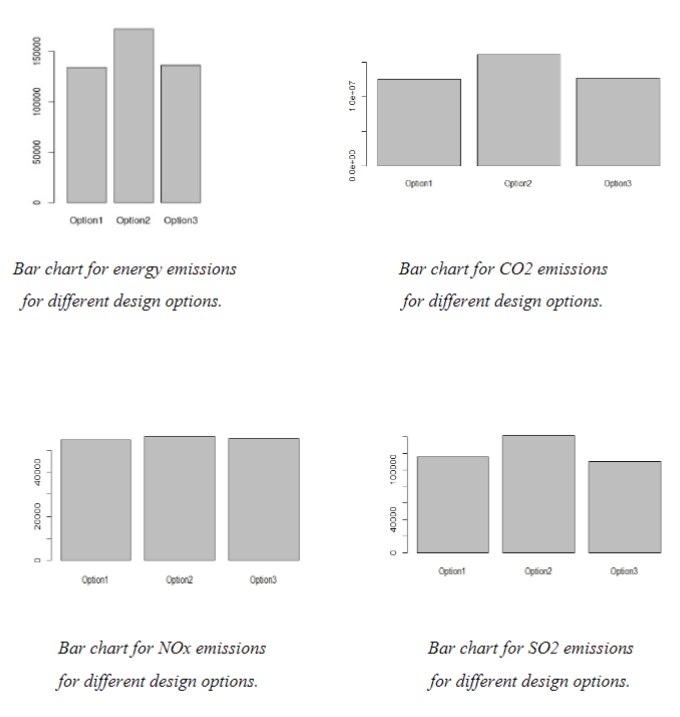
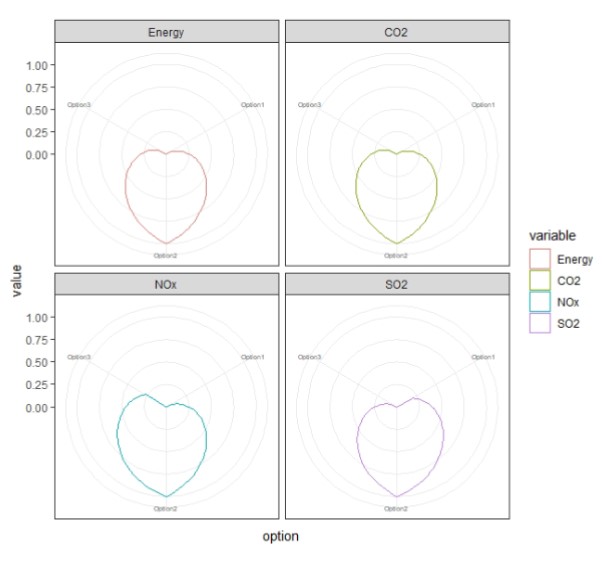
Life-Cycle Inventory: Consideration of different pavement options leading to different numbers of materials, as well as different interventions are taken into account as per the timelines that are obtained in the above results. A similar part to each of the design options is asphalt. The data pertaining to the above details are automatically selected to create a matrix containing the information that is required for life cycle analysis. Based on the information, the total amount of materials for the slab elements as well as the total amount of materials consumed during the lifecycle is calculated. LCA results are extracted by creating the bar plots for each other indicators namely, for energy consumption levels, CO2 emissions, NOx emissions, and SO2 emissions.
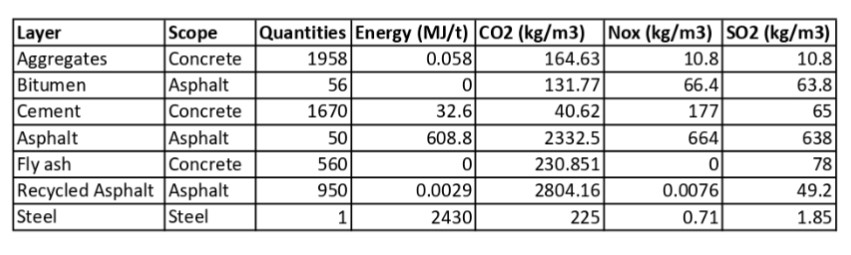
The blow table depicts the Life Cycle Inventory of different materials, performance, and environmental indicators:
The bar plots that were obtained are as follows:
Radar Plot:
Other systems: