In the modern world, most of the engineering problems require dealing wiht multiple conflicting objectives instead of a single objective. For such scanerios, the multi-objective optimization is an efficient techniques for finding the best set of solutions. Multi-objective evalutionary algorithms are able to approximates the true pareto solutions of multi-objective problems.
Optimization :
Figrure 1.
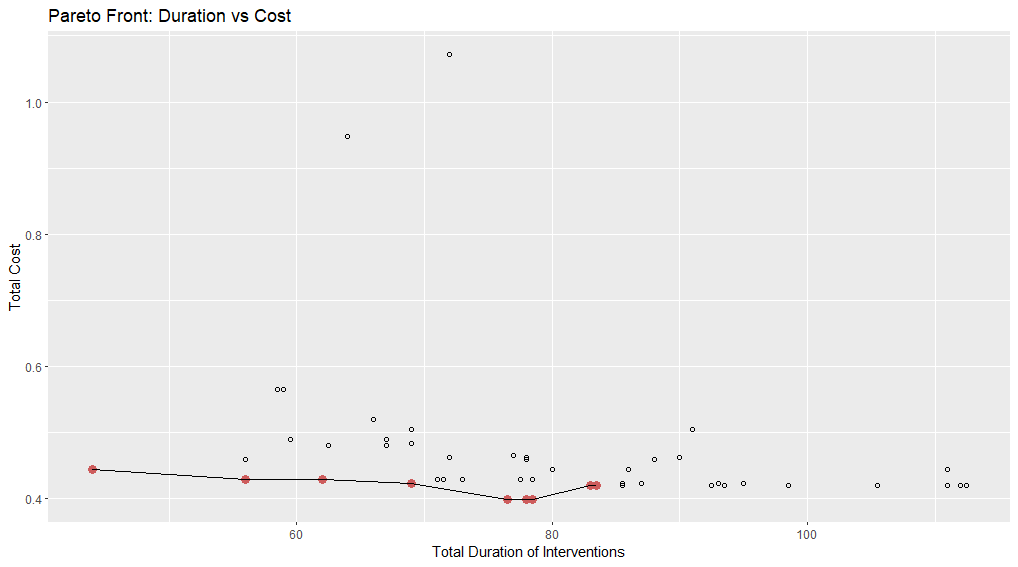
Analysis of Pareto Front : Duration vs Cost :
The Plot of Figure 1. is an excellent representation of multi-objective optimization, allowing us to make informed trade-offs between cost and duration.
- Black dots represent different solutions (design points) in the optimization problem. The red dots with the connected black line represent the Pareto-optimal solutions, which form the Pareto front.
- There are several non-Pareto solutions (black dots above the front), meaning these solutions are dominated by the Pareto-optimal solutions.
- If cost is the primary concern, solutions in the range of 50-80 duration offer the best trade-off.
- If reducing duration is more critical, the lowest-duration solution on the Pareto front should be chosen, even at a slightly higher cost.
In order to fully understand the complex relationship between the objectives in a multi-objective optimization problem, the following analysis demonstrates the key trade-off points and how the design parameters affect the optimization results. A Parallel Coordinate Plot (PCP) is a powerfull tool for visualisation used to analyse data, which allow us to compaire multiple variables. Each vertical axis in the PCP represents a different design parameter or objective, and each line represents a solution, showing how different parameter combinations impact multiple objectives.
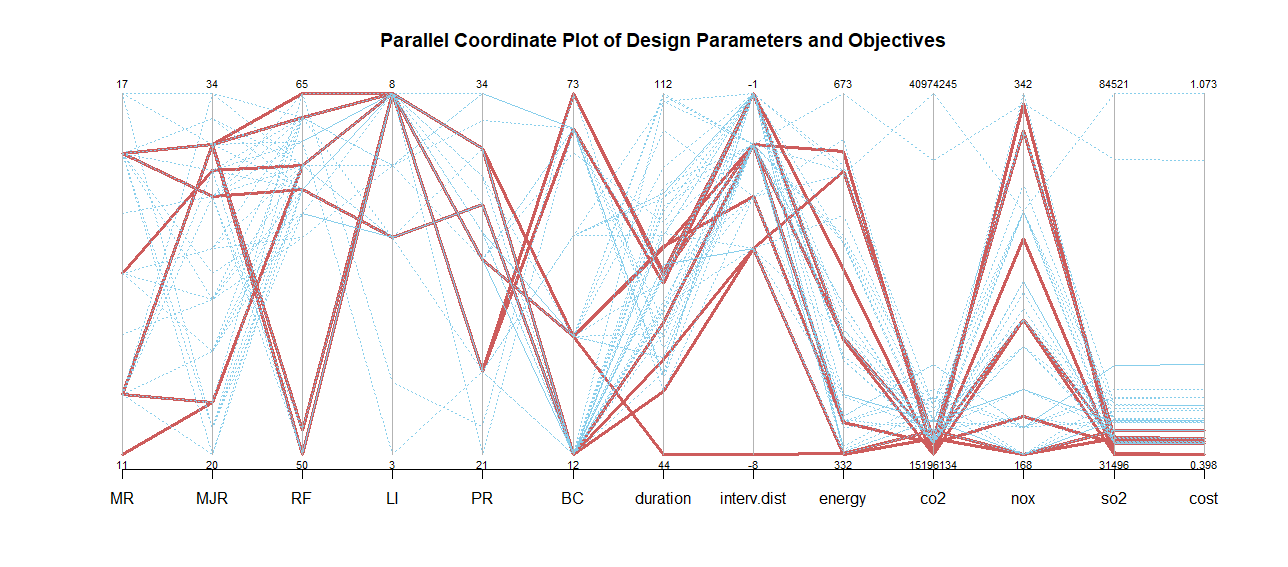
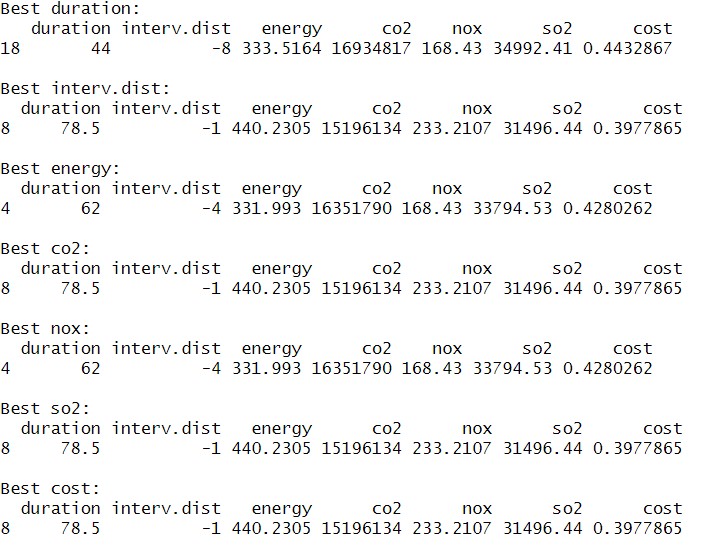
Figure 2.
The plot above in fiugure 2. analyzes a multi-objective optimization (MOO) problem using a PCP, highlighting the trade-offs between various objectives such as duration, interval distance, energy consumption, CO₂ emissions, NOₓ emissions, SO₂ emissions, and cost.
Discussion of result :
Trade-offs Between Duration, Cost, and Emissions :
- The shortest duration (44) results in higher CO₂ (16.93M) and SO₂ (34.99K) emissions but lower NOₓ emissions (168.43) compared to other solutions.
- The lowest cost (0.398) is associated with higher energy consumption (440.23) and NOₓ emissions (233.21).
- A longer duration (78.5) is preferred when optimizing for emissions and cost, as it minimizes CO₂ and SO₂ while keeping costs low.
Impact of Interval Distance (-1 vs. -8) :
- Interval Distance = -1 is optimal for cost, CO₂, and SO₂ emissions.
- Interval Distance = -8 improves duration but increases emissions and cost.
Energy Efficiency vs. Environmental Impact:
- The most energy-efficient solution (331.99) provides a balanced trade-off between emissions and cost.
- The most cost-effective solution (0.398) consumes more energy (440.23) and has higher NOₓ emissions (233.21).
This analysis using a Parallel coordinate plot has given a comprehensive knowledge of trade-offs involed in optimising multiple objectives. In simple words, when trying to improve one aspect , such as reducing cost or energy consumptions, other factors may get affected.T he result shows that finding the right balance between objectives is important. Lower cost often comes with higher energy use and emissions. Shorter duration may increase cost and emissions. A balance between interval distance and energy efficiency can help reduce both cost anmd impact on enviornment. By carefully selecting design parameters , we can improve efficiency while keeping the cost and emission of gases low. Using more advanced techniques we can further refine these choices and help make better engineering decesions.