Sim function
With the implementation of the sim function in the code it was possible to calculate the interdepencies for the interfaces of infrastructure and energy. Because of our analysed interdependencies the following sim functions are implemented:
1. It is either possible to maintain the dam or the offshore wind turbine at the same time, because otherwise no energy is provided for the seawater reverse osmosis nor the tunnel.
2. For functionating infrastructure a second sim function has been implemented, because without a dam and a tunnel were is no working infrastructure anymore.
The results of the sim functions marks the year when nevertheless either the infrastructure systems or the energy systems are maintained at the same time. As you can see of the results on the code below this problem happens for the infrastructure 9 out of 100 years and for the energy 18 out of 100 years.
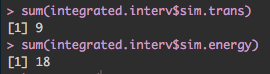
Figure 1: Code results of sim functions energy and infrastructure
So, for 9 Years alternative infrastructure routes have to be provided. Otherwise people cannot cross the river. For the seawater reverse osmosis plant and the tunnel alternative energy sources has to be provided in a total of 18 years. Consequences would be no provided drinking water and disregarding from no electricity for emergencies lights the air condition wouldn’t work in the tunnel. This could mean that it is dangerous to use the tunnel for this time, because of carbon monoxide poison.
Timelines of maintenance interventions
Each System on its own need a maintenance strategy to optimize the system. In the bigger context it is also necessary to integrate the subsystems in a big system where all parameters are dependent from each other.
Dam
The total life time of a dam focused on the gate counts 50 years.
For further information for the maintenance strategies go to domain subpage: dam
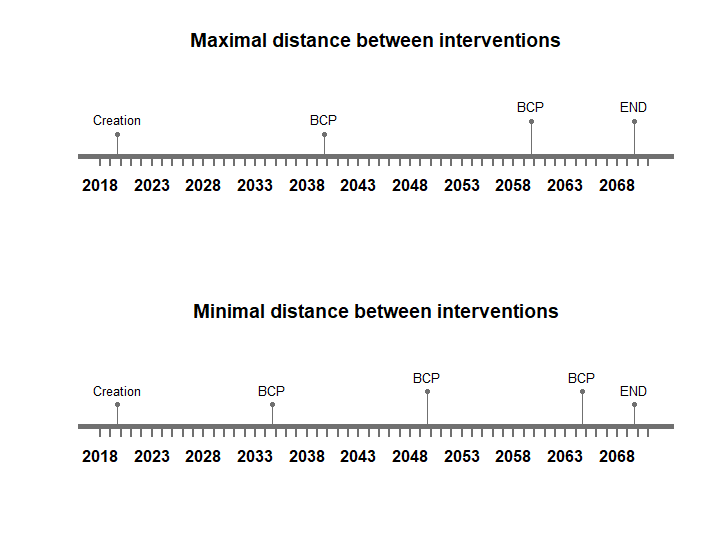
Figure 2: Timeline of expected maintenance interventions for the dam (maximal and minimal)
Offshore Wind Turbine
The total life time of an offshore wind turbine counts 30 years.
For further information for the maintenance strategies go to domain subpage: Offshore wind tubine
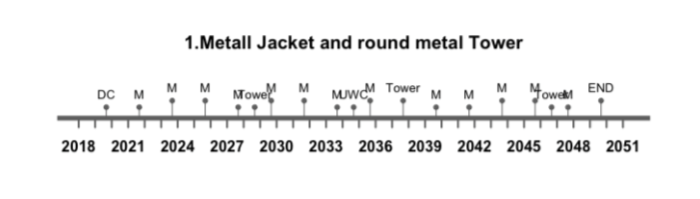
Figure 3: Timeline of expected maintenance interventions for the offshore wind turbine
Seawater Reverse Osmosis Plant
The total life time of a seawater reverse osmosis plants counts 20 years.
For further information for the maintenance strategies go to domain subpage: Seawater reverse osmosis plant
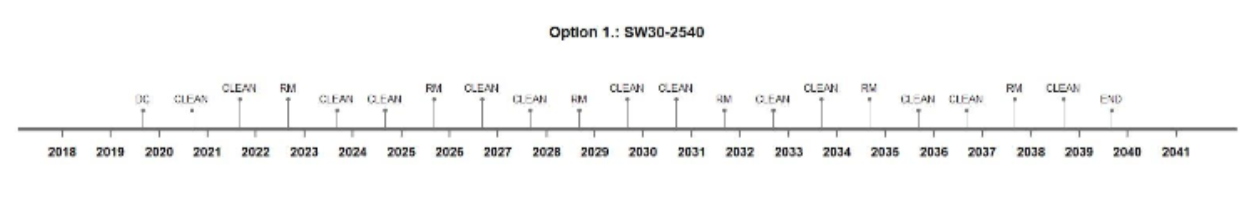
Figure 4: Timeline of expected maintenance interventions for the seawater reverse osmosis plant
Tunnel
The total life time of a tunnel counts 100 years.
For further information for the maintenance strategies go to domain subpage: tunnel
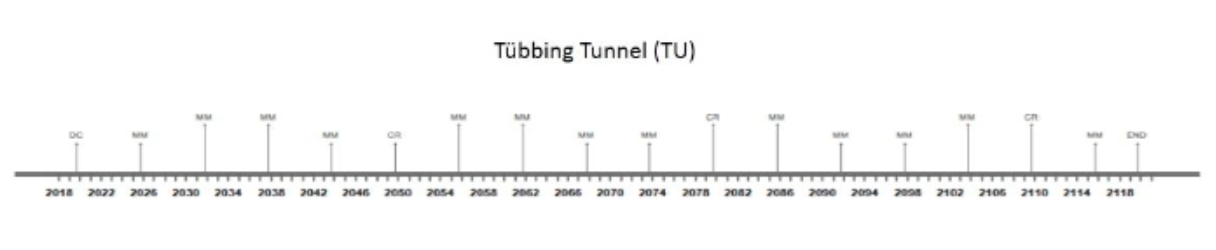
Figure 5: Timeline of expected maintenance interventions for the tunnel
The basis of the maintenance strategies of each subsystem itself, leads in the integration context to the following results. One assumption, which has been made here, is that the overall focused life span is now 100 years. This is necessary because of the leading system of the tunnel.
Pareto plots
After integrating the maintenance strategies for all systems the following pareto plots were visualized for the main system and as well as for all systems. For the main system just the systems dam, tunnel and seawater reverse osmosis are considered. The offshore wind turbine is in this case a alternative, because the dam can also provide energy. The preference used in general are: minimal costs, minimal duration, maximal time between interventions. At first the focus will be on all systems.
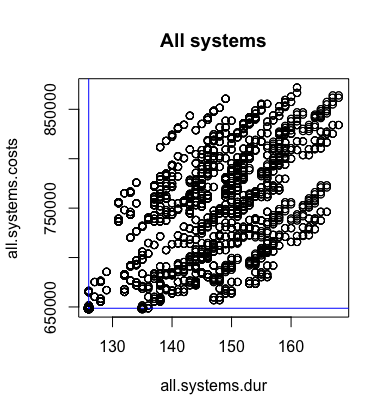 Figure 6: Pareto plot all systems costs to duration
Considering the preference of minimal costs and minimal duration time it makes sense that the optimal point for all systems is just on the left down corner. But it is not really flexible as a system option to follow and more of an overall goal, which could be on the long term considered. These preferences together are very strong and not flexible.
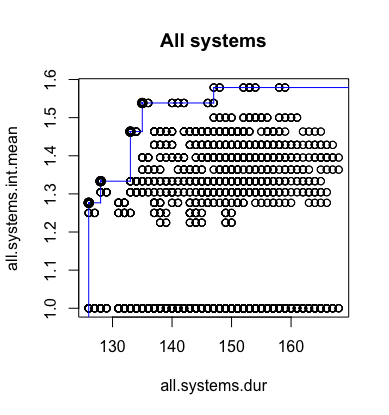 Figure 7: Pareto plots all systems intervall (mean) to duration
For the duration time (days) compared to the interval time (years) a pareto plot has been visualized, which is shown in figure 7. The preferences here are minimal duration time and maximal interval time, which should led idealy to minimal costs. The systems offshore wind turbine and seawater reverse osmosis plant both have interventions with an interval of one year, which explains the pareto points visualized yearly. In general the duration is not equal to the downtime. Because for some maintenance actions like the inspection of the tunnel the system don’t need a shutdown. For the specific downtime considering the effectivity of the systems during maintenance is refered to the different subpages of the domain.
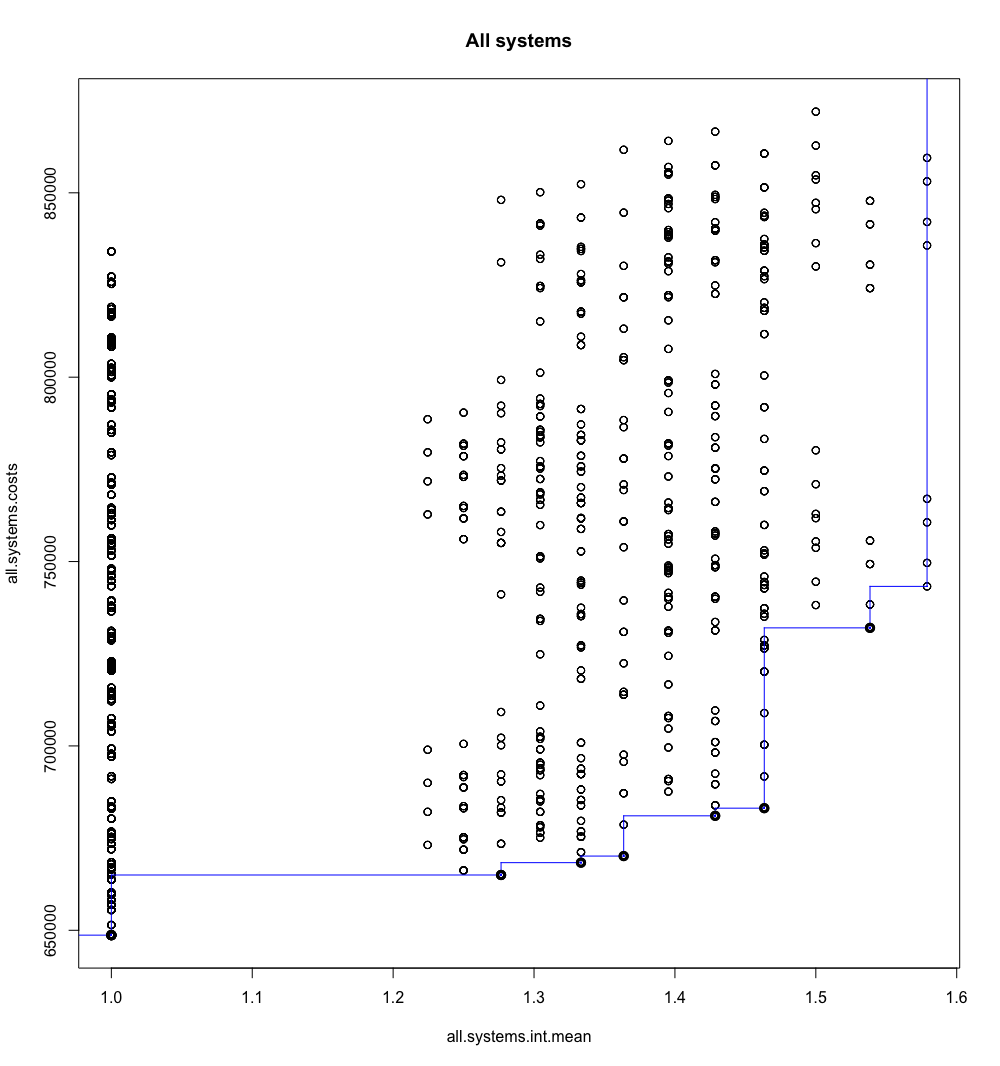 Figure 8: Pareto plot all systems costs to intervall (mean)
For the analysis of the intervall (mean) time (years) and the costs (euro) another pareto plot is provided and shown in figure 8. The used preferences are minimal costs and maximal interval time. Therefore a lot of optimal solution could be found as shown in figure 8.
The pareto plots for the main system are visualized in the following.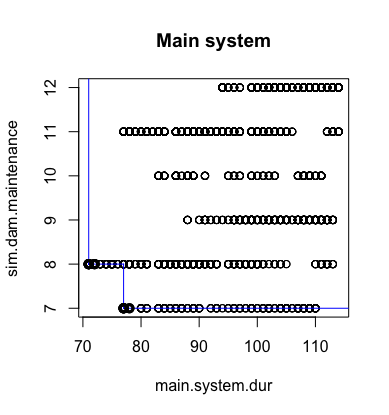 Figure 9: Pareto plot main system duration time to simultan maintenance obtained for the energy
The duration time is considered in days per year and the maintenance problem with the simultanious interventions give the exact year in the life span of the whole system. So, considering the results means that for lower duration time the parallel maintenance of the energy systems happens in year 8. For longer duration time it already occured in year 7.
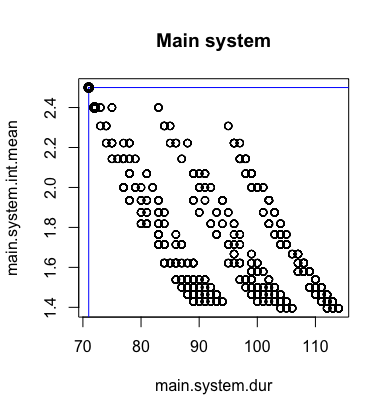 Figure 10: Pareto plot main system intervall (mean) to duration time
The pareto plot above shows only one option because the preferences are to maximize the interval and minimize the duration time.
The hereby deduced results of the integrated maintenance planning strategies are furthermore analysed in the Life cycle analysis and the multi objective optimization.