1. Introduction
2. Goal and Scope
The selected system is an office building. It is composed of the following main components:
- Columns
- Beams
- Foundation
- Walls
- Roof
- Ceiling
The office building ensures space for 100 workers. At least 10m2 are required per worker [1]. It is assumed that there is a total building area of 500 m2. Therefore, the building will have two floors. The minimum height of each floor is 3 m [2]. Each frame has a length of 10m and a width of 10m. Accordingly there will be 5 frames, which will be distributed in the building area. Therefore, the number of columns is 10.
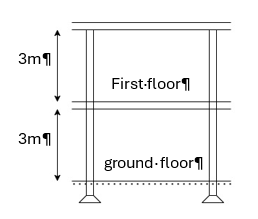
Figure 1 Frame Construction
The goal of this assignment is to do an emission analysis and find the product with the least amount of CO2, NOX and SO2 emissions. The selected subsystem are the columns of the office building. The three different design options are presented in the following chapter.
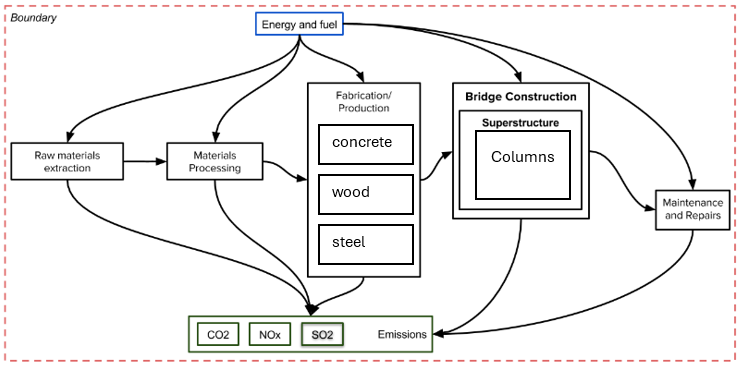
Figure 2 shows the scope and the boundaries. In general, the scope establishes the processes and boundaries required to achieve a specific objective. Since the aim of this work is to analyze energy consumption and greenhouse gas emissions, all relevant parameters that influence these factors were considered, including raw materials, production, and maintenance.
3. Design Options
For the columns three different materials will be used to showcase the best choice.
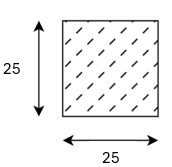
The first option is the most common among office buildings. A reinforced concrete frame has the benefits of its low material costs and easy shaping of the material. The dimension can be skimmed using the SBT 4.122 [3]. The cross section following the SBT is 25x25cm. The concrete is a C30/37.
The second design is a steel column. For this option a HEB 200 is used following the SBT [3]. Even if the sheet is an example of a hall. It comes close to the chosen system. Steel has many benefits. It is strong and won’t deteriorate over time. It is fire resistant, termite proof, sustainable and cost effective [5].
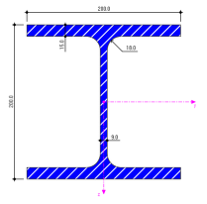
Figure 4 Design option 2 [6]
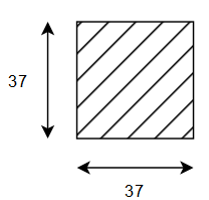
The third design option is a column made from wood. Wood is sustainable for the environment and climate neutral. Using the SBT 4.127 [3] a C24 h = 37cm is used to construct the columns.
2.1 Life Cycle Timeline
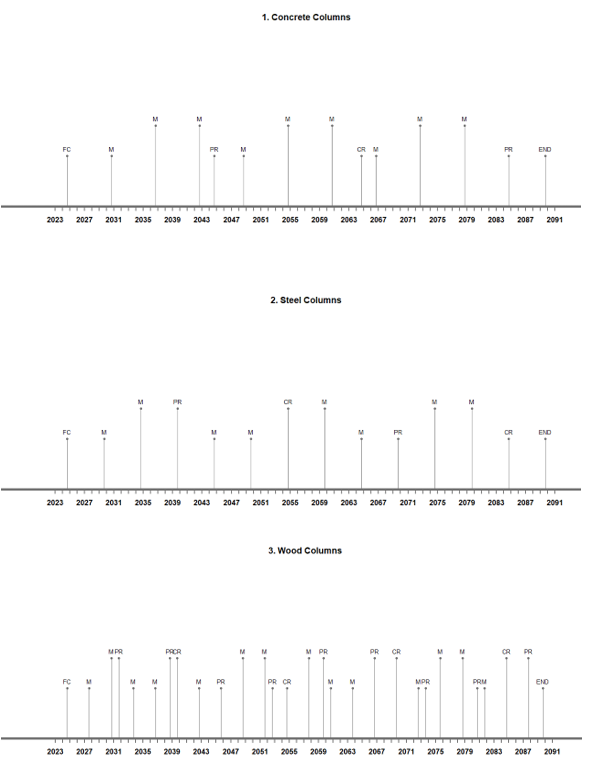
The average lifetime of an office building is 65 years. According to [7] concrete and steel do not need as much maintenance works and replacements as timber. Therefore, the frequency is lower. The reason why the maintenance and replacement frequency of concrete is lower than steel is because concrete can comprehend pressure better than steel. Therefore, it is expected that a concrete column is more durable than a steel column. If we consider other subsystems, the values may differ.
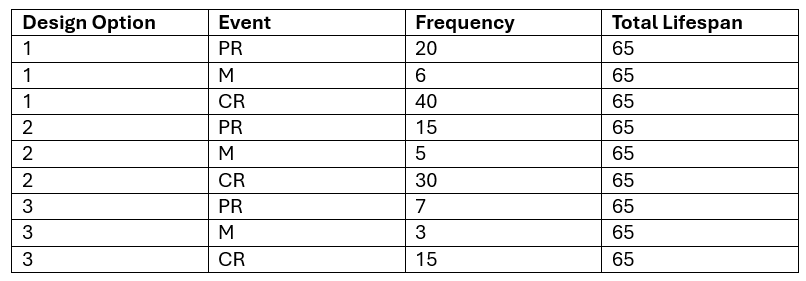
Table 2 Events and their frequencies
M = maintenance
PR = Partial replacement
CR = column replacement
2.2 Life Cycle Inventory, Performance and Environmental Indicators
Table 3 shows the different materials used. The scope outlines the inclusion of specific materials in the composition of a particular mixture. Additionally, the quantities specify the amount of each material, measured in kilograms, required to produce 1 m³. For each material, data on energy consumption and greenhouse gas emissions were gathered and totaled. Greenhouse gas emissions are expressed in units of kg/m³. The given example is used as a reference, because the used materials are the same.

Table 3 Materials and their energy consumption and emissions
2.3 Life Cycle Cost Analysis
The boundary of this assignment includes only the environmental factors. Consequently, the cost analysis for the three design options will be conducted based on their energy consumption and greenhouse gas emissions.
The Volumes of the different column designs are calculated as followed:
Design Option 1 – Concrete Columns:
b=h=25cm
a=10 (number of columns)
l=6m
V1=0,25m*0,25m*6m*10=3,75m^3
Design Option 2 – Steel Columns (HEB 200):
A=78,1cm^2
a=10 (number of columns)
l=6m
V2=7,81*10^(-3) m^2*6m*10=0,47m^3
Design Option 3 – Wood Columns:
b=h=37cm
a=10 (number of columns)
l=6m
V3=0,37m*0,37m*6m*10=8,21m^3
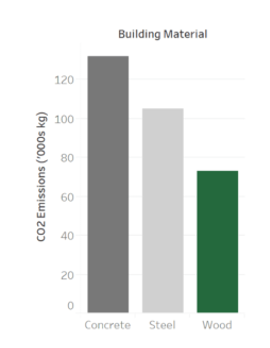
Figure 7 shows the results of the cost analysis. It shows that steel-columns have the lowest energy consumption and emissions. The main reason for this result is that the volume of the steel frames is significantly lower than concrete or wood. However, it was expected that wood would be the most efficient out of these three options. The volume used for wood and concrete is simply too high. The more material is used, the more energy will be consumed, and the emissions will be higher.
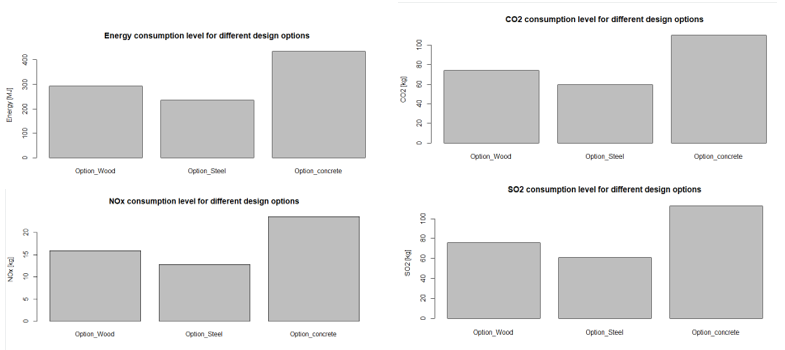
Figure 7 Energy consumption and Emissions
Figure 8 shows that even though wood is the most emission friendly / kg material. The material we must use is so high that the advantage can’t be seen. However [9] also states that wood is the best option for office buildings. “Avoided emissions are rather straightforward. The manufacture and transport of mass timber uses less energy and emits less carbon than similar processes for concrete or steel. For an amount of product with the same amount of strength, mass timber emits fewer GHGs.” [9]. This statement goes against the results of this assignment.
The conclusion is that the calculated volume for wood-columns is unnecessarily high. Further optimization must be made in the future. Based on this research using wood is the best option for the environment. However, this assignment proceeds with the calculations made before.
4. Multi-Criteria Decision Making (AHP)
Following the cost analysis, the Analytic Hierarchy Process (AHP) is employed to conduct a multi-criteria decision analysis. AHP helps simplify complex decisions, enabling them to be approached more systematically and rationally.
According to [10] the Energy consumption of Concrete and steel is nearly 5 and 6 times more than wood. The Energy consumption of steel is slightly lower than concrete. To mimic that the number 2 is given.
Table 5 is based on figure 8. Concrete has emissions nearly three times more than wood and significantly more than steel.
According to [11] steel does not have high SO2-Emissions like concrete. However, they are still very high. Wood nearly does not have any SO2-Emissions. Table 6 shows the used impact of SO2 on the different systems.
According to [12] the worst NOx-Emissions come from steel. Wood nearly does not have any Nox-emissions. In comparison to wood the difference of emissions is so high that factors 9 for steel and 7 for concrete are used
Table 8 shows the CWPC. CO2 is the main reason for climate change. That’s why it is ranked the highest. Energy is the source of all emissions. That’s why it is central for sustainability. That’s why it is ranked second to CO2. NOx causes health problems and is a main reason for air pollution. It is ranked third. Sox is not a big problem in modern times and the pollution can be prohibited. That’s why it is ranked fourth.
Looking at figure 9. It is clear that wood is the best option considering our adjustments. The second best option is concrete and the worst option is steel. Considering only environmental issus wood is the best option. In real live there are always other things to consider. Such as cost, time, management and avalibilty. These are the main reasons why concrete is so commonly used in europe. This analyisis highly depends on our goal and our boundaries.
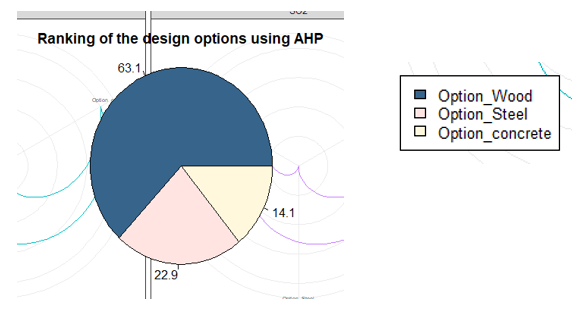
Figure 9 Ranking of the design options using AHP
Even though there was a mistake calculating the wood volumes. The best option is still wood. That’s why even with too many used resources wood still can outperform concrete and steel. Over 63% is in favor of wood as the best option for an environment-friendly office building. The main reason for that is that CO2-Emission are ranked so high that by that factor alone concrete and steel cannot compete with wood. Looking at political and global decisions, that approach is realistic in these times as CO2 is the main reason for global warming.
[1] https://umwelt-online.de/regelwerk/cgi-bin/suchausgabe.cgi?pfad=/bau/laender/hb/bueroflrl.htm&such=Richtlinie
[2] https://www.haufe.de/arbeitsschutz/sicherheit/arbeitsstaetten-regel-wie-viel-platz-muss-im-buero-sein_96_224924.html
[3] Schneider Bautabellen für Ingenieure 24. Auglage
[4] https://bauforumstahl.de/wp-content/uploads/2024/06/B.3.1_Arbeitshilfe_Stuetzen_und_Binder_bei_Hallen.pdf
[5] https://jgkinghomes.com.au/blog/6-benefits-of-steel-framed-housing
[6] https://www.dlubal.com/de/querschnittswerte/hea-120-euronorm-53-62-din-1025-3-szs
[7] https://skyciv.com/technical/steel-vs-timber-vs-concrete/
[8] https://www.researchgate.net/figure/Lifi-c-sc-c-inventors-results-tar-total-emissions-on-a-per-tout-basis-el-planed-cbs_tbl4_43310528
[9] https://mantledev.com/insights/embodied-carbon/mass-timber-carbon-impact/
[10] https://websites.umass.edu/natsci397a-eross/what-building-material-wood-steel-concrete-has-the-smallest-overall-environment-impact/comment-page-55/
[11] https://arxiv.org/abs/2201.13356?utm_source=chatgpt.com
| Main Page | Introduction | Integration Context of the Civil Systems | Maintenance Strategies | Life Cycle Analysis | Multi-Objective Optimization |
