Maintenance planning for civil systems is critical to ensuring their life-time functionality, sustainability, and cost effectiveness. A system follows its predefined maintenance actions to prolong its service life and efficiency. Unfortunately, this isolated strategy can not be adopted in an integrated context. In such environments, the systems are highly correlated where an intervention of a system can impact the performance, longevity and maintenance needs of another.
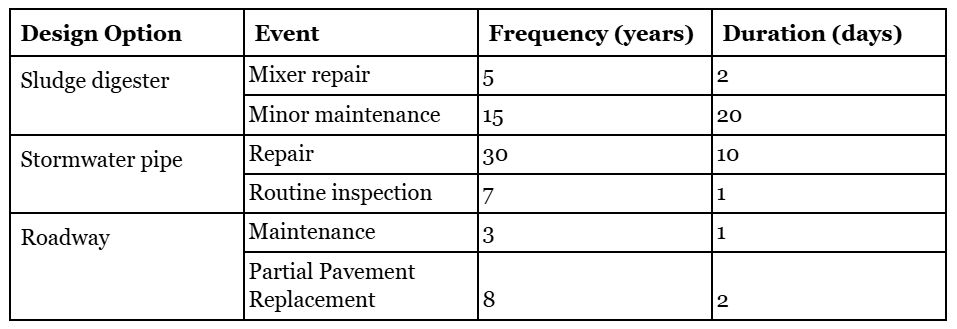
Each system within the combined urban system requires regular maintenance based on its functional needs and deterioration rates. Taken from Project 2, Table 1 shows the combined matrix where frequency is the time between maintenance events and duration is the time the system spends offline during maintenance. The combined maintenance interventions for the urban sewer system are outlined in Table 1 below:
To determine the most effective integrated maintenance strategy, the best design options for the sludge digester, roadway, and stormwater pipe system were all combined over a 40-year life cycle. From Figure 2, we can find the individual graphical timelines of the the distribution events of each of the three systems over the lifetime.
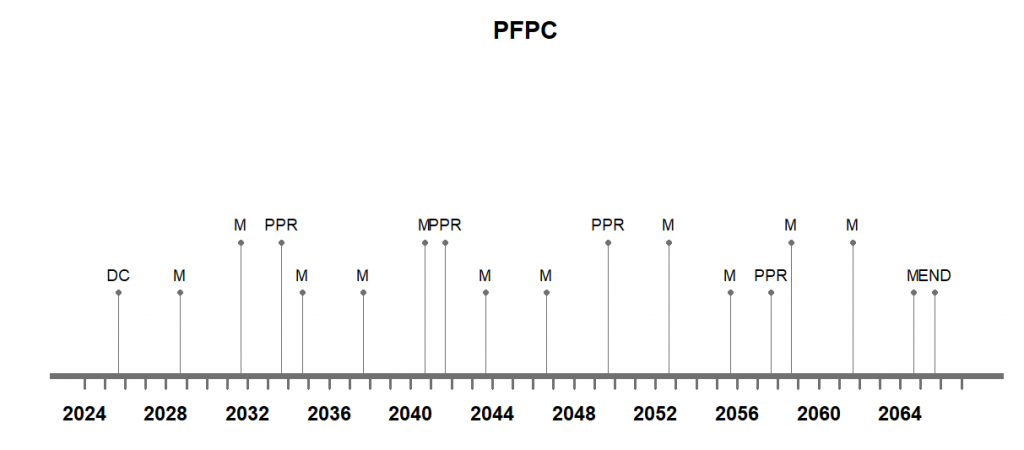
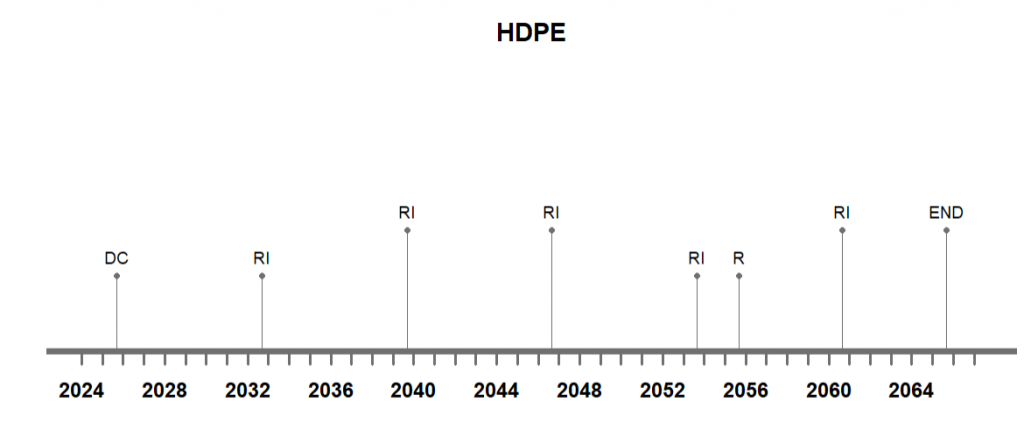
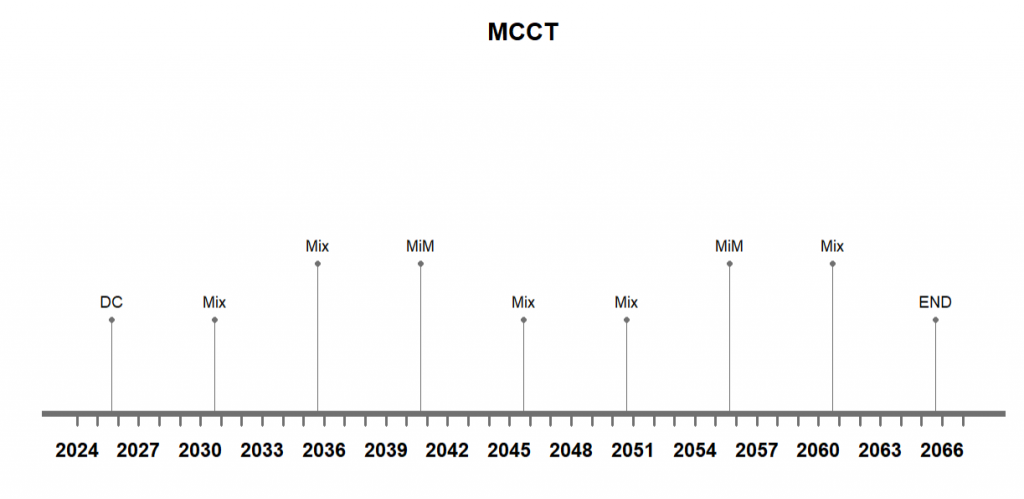
Figure 1: Individual Timelines of (a) Road Pavement, (b) HDPE pipe, and (c) Sludge Digester
The integrated maintenance approach aims to optimize the roadway system, stormwater drainage system, and wastewater treatment (sludge digester) by coordinating maintenance schedules. Using a multi-objective optimisation approach, the method seeks to achieve the goal of minimising the intervention duration while increasing the interval between maintenance actions in order to reduce interruptions and cost. By this integration, we can visualize and understand the total downtime of the combined system, which is a total maintenance interruption duration of 71 days over the lifecycle.
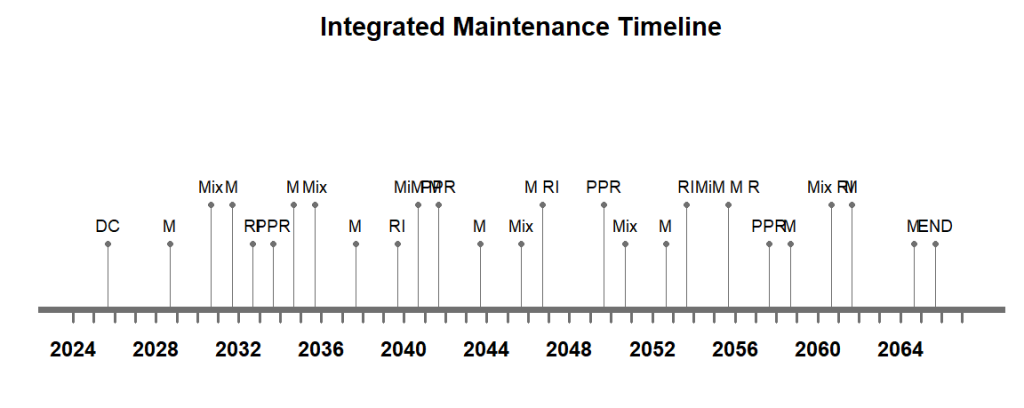
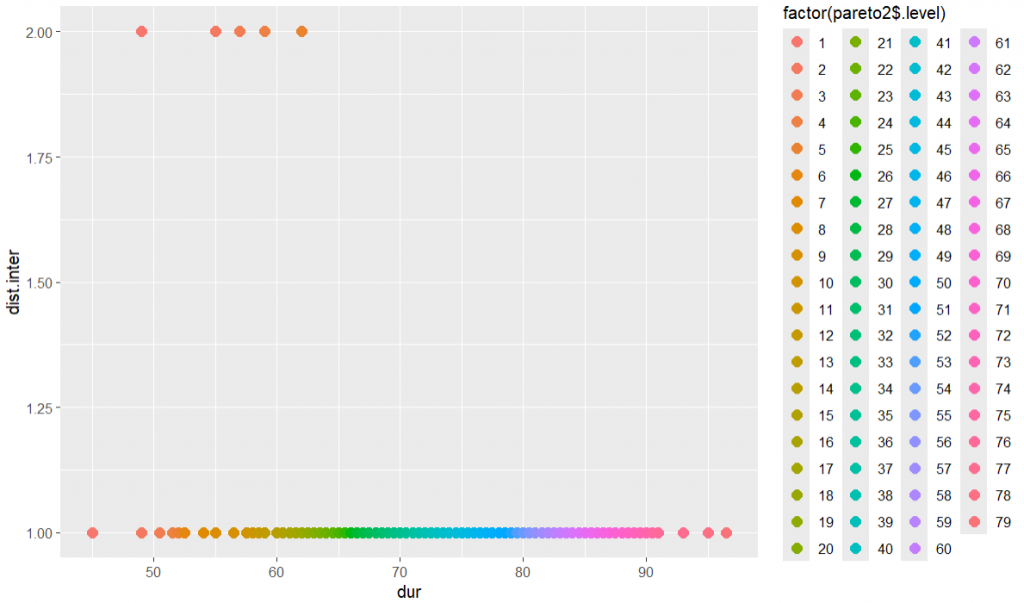
The Pareto analysis was used to optimize the integrated maintenance approach by balancing two competing goals: reducing overall maintenance intervention length and increasing the gap between maintenance actions. This technique ensures that maintenance jobs are carefully scheduled to minimise disruptions and expenses over the 40-year period. Multi-objective optimization was used to develop numerous design possibilities, each indicating a distinct trade-off between the overall duration of maintenance tasks and the time intervals between them.
From the optimization results, the integrated intervention scenarios given in the table below were ranked to be most optimal and efficient in lowering the total downtime to 45 -49 days, over the lifecycle. By avoiding misaligned maintenances, The synchronisation of the intervention of the systems prevents frequent disruptions leading to more stable and efficient function of the systems. The first scenario that spans a total duration of 45 days, achieves an optimal trade-off between effective maintenance, downtime reduction and system longevity. By the alignment of events for example, MiM and R of the digester and pipes respectively, not only the frequency of separate disruptions are reduced, rather the full functionality of the overall system can be regained at the same time.


In this least optimal solution of the combined interventions, its evident that the misalignment of the events and more frequent disruptions thus lead to higher cumulative downtime, which contradicts our main focus.
The results were ranked by a Pareto front, with the x-axis representing the overall maintenance duration (in days) and the y-axis representing the shortest interval (in years) between operations. Lower maintenance periods were found to be associated with shorter intervals between treatments, increasing the frequency of disruptions. On the other hand, Longer intervals between maintenance events result in higher total maintenance durations but less disruptions over time.
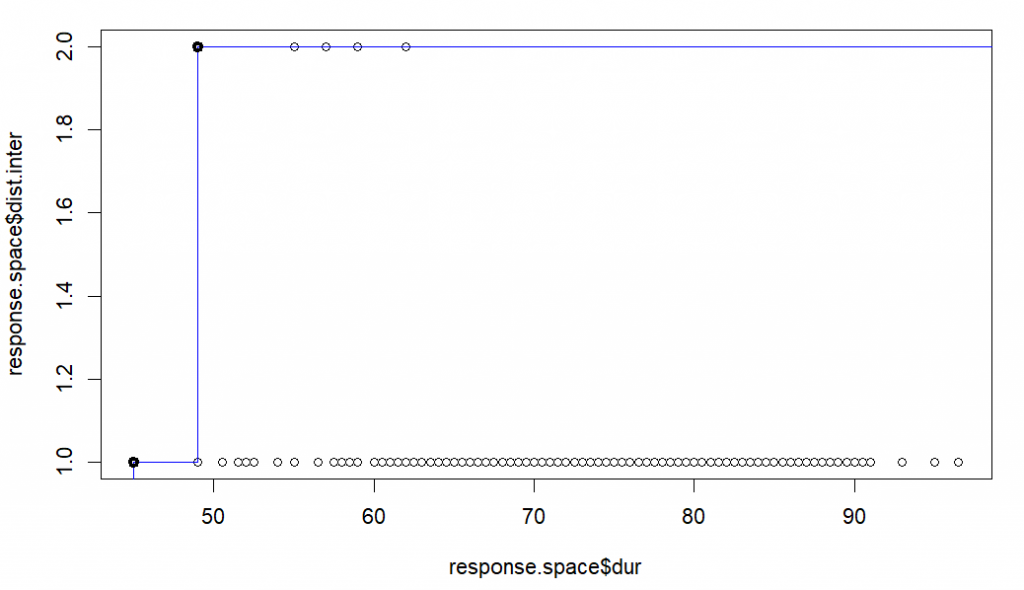
Based on the Pareto-optimal solutions, This approach effectively balances maintenance scheduling while ensuring that interventions are spaced efficiently to avoid excessive disruptions. The strategy combines maintenance activities for the roadway system, stormwater drainage, and sludge digester, optimizing resource allocation and lifetime system resilience and remains under the goal service level of being offline only a maximum of 0.005% of the time, or 73 days. While this scenario meets the goals, additional stages of the model were built to see if resources could be saved in addition to reducing downtime, see the Life Cycle Analysis and Multi Objective Optimization pages.
→ Next Page: Life Cycle Analysis
← Previous Page: Integration Context