The previous section provided an overview of the updated Life Cycle Analysis (LCA) conducted for the integrated infrastructure system, consisting of the road tunnel, sewer network, and warehouse. This updated LCA considers the material quantities required for each system based on its specific operational demands, structural dimensions, and expected service life. Additionally, it accounts for the additional material needs arising from planned maintenance interventions. Within the scope of this LCA, each material is evaluated based on energy demand, CO2, NOX, SO2 emisions and total cost, ensuring a comprehensive sustainability assessment.
Introducing a Multi-Objective Optimization Process
Unlike the section on Maintenance Strategies, which primarily focused on system downtime and the frequency of maintenance interventions as key performance criteria, this section introduces a Multi-Objective Optimization (MOO) process to provide a broader and more holistic evaluation. This is essential because each maintenance activity does not only impact the availability and functionality of the systems but also influences their energy demand, environmental impact (CO₂, NOX, SO2 emissions), and associated costs, including both material expenditures and labor efforts.
Given the interdependency of the road tunnel, warehouse, and sewer network, maintenance strategies cannot be considered in isolation. Disruptions in one system—whether due to regular maintenacene , partial replacement, or Full Lifecycle Replacement—can have cascading effects on the others, leading to operational inefficiencies, increased costs, and potential safety hazards.
To effectively assess and optimize maintenance strategies, it is crucial to integrate these interconnected performance criteria—energy demand, environmental impact (CO₂, NOX, SO2 emissions), and associated costs—into a system-wide decision-making framework. This allows for a more sustainable and cost-effective long-term management of the infrastructure, ensuring uninterrupted functionality while minimizing environmental and economic burdens.
Design Parameters
Based on the previously established ranges for the intervention strategies we chose to include them in the MOO as well. The performance criteria to be evaluated encompass the overall system downtime and minimum frequency of interventions.

Optimization
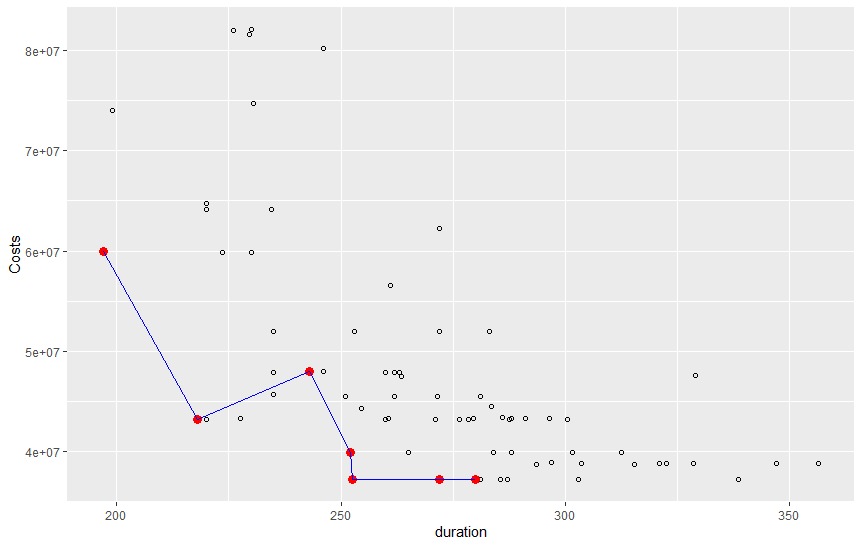
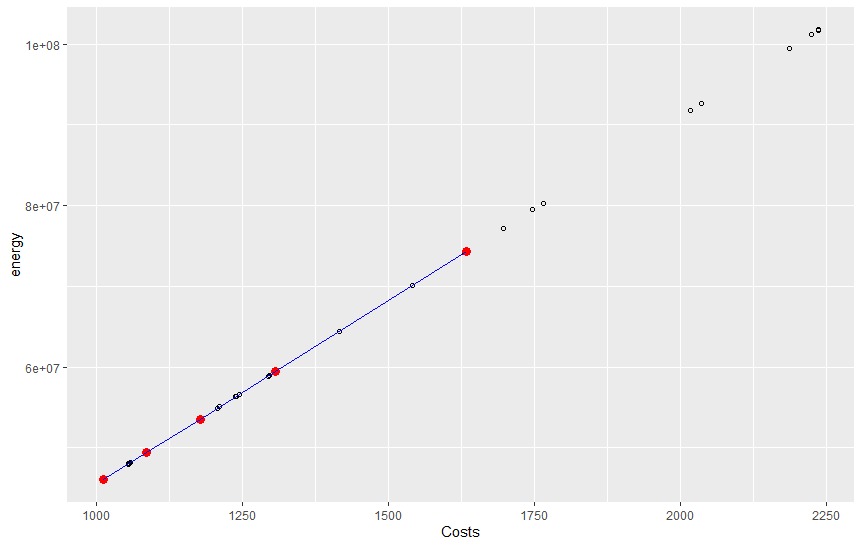
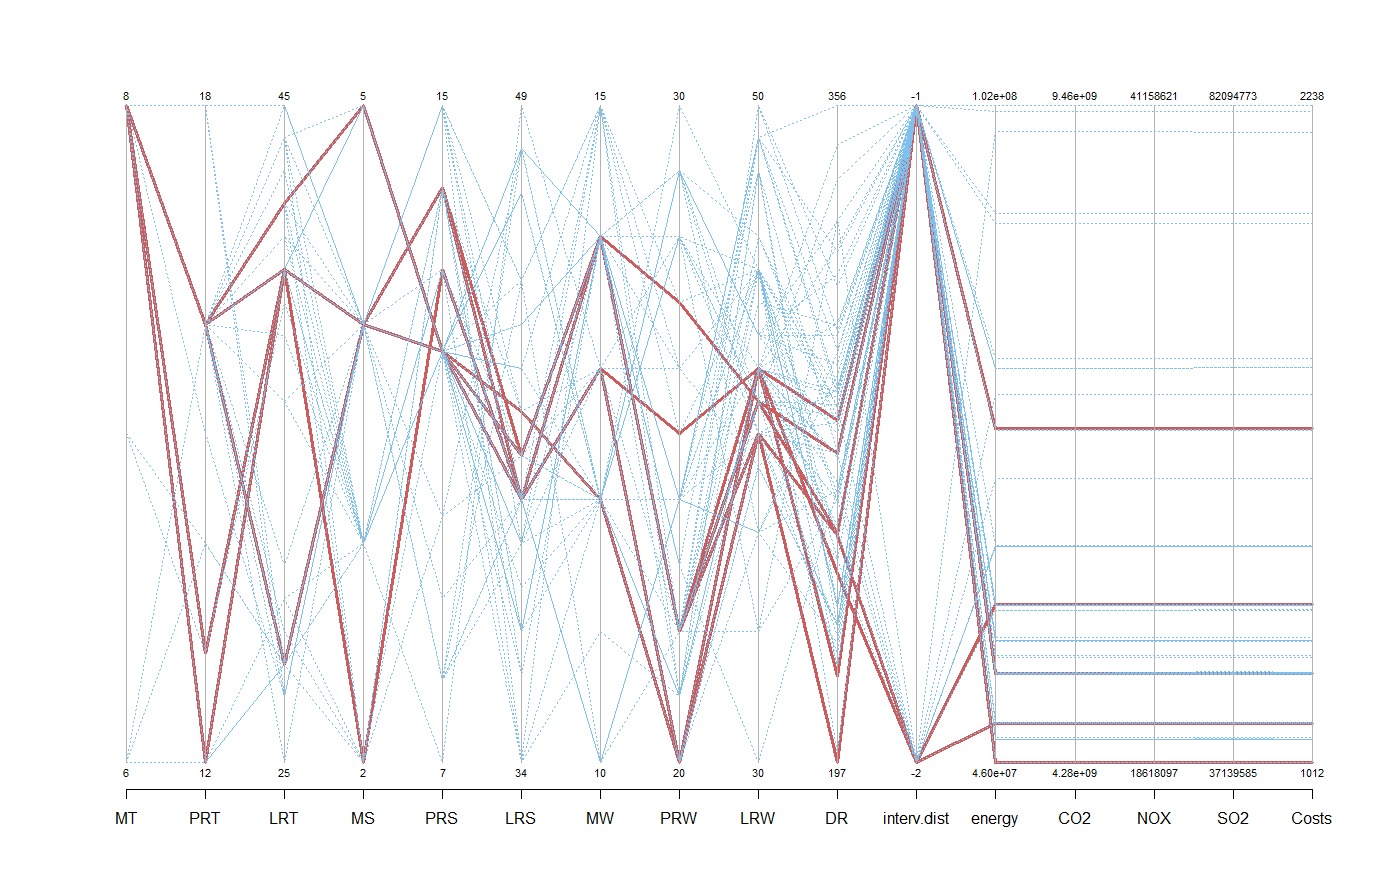
Figure 2-3 present results from the optimization process, depicting the pareto fronts for two performance criteria each.


Maintenance Frequency and Duration
When comparing these results with those from the previous maintenance strategy optimization, we notice that the Pareto fronts now include significantly higher system downtime values and considerably lower intervention frequencies. This shift occurs because the prior optimizations focused solely on minimizing downtime and extending the intervals between interventions. However, with the inclusion of material-related criteria the Pareto-optimal solutions are now influenced by these additional factors. This influence is reflected in the slightly irregular distribution of Pareto optima in the plots, which can be attributed to the fact that the optimization process considers five performance criteria, while each plot only visualizes two of them.

With multiple red lines occurring we can say that there are multiple Pareto optimums. It is interesting to point out that energy demand and CO2 emissions show significant variation, indicating that some intervention combinations result in higher energy demand and higher environmental impact. The same applies to the total costs. These showcases the potential of MOO and the different cascading impacts that can be observed thanks to it. One thing that all have in common is to keep the duration lower.