To analyze various maintenance planning strategies, we implement the nsga2() function, a genetic algorithm for multi-criteria optimization. This function is structured based on our priorities for minimization, incorporating the number of input variables, output measures, and predefined lower and upper bounds for each input parameter. By optimizing these factors, the algorithm identifies the most effective maintenance combinations while balancing serviceability, cost, and environmental impact.
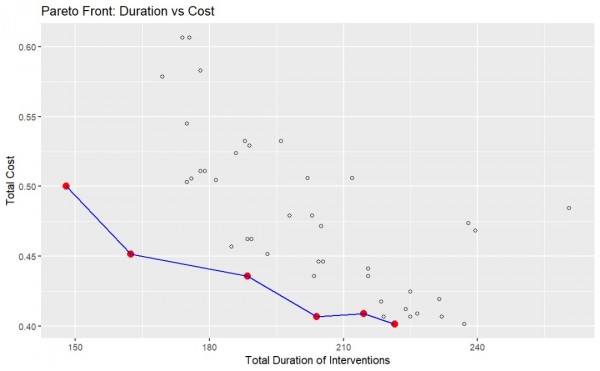
To, illustrate the trade-off between total maintenance duration and total cost a Pareto Front graph is generated (Figure 1). Each black dot represents a possible maintenance strategy, while the red points connected by the blue line form the Pareto-optimal solutions show the most efficient trade-offs between duration and cost. These solutions represent the best trade-offs where neither cost nor duration can be further improved without worsening the other. By Moving along the Pareto front from left to right, cost decreases as duration increases. This suggests that shorter maintenance durations come at a higher cost, while extending the duration allows for cost reduction. The scattered black points above the Pareto front indicate suboptimal maintenance strategies that are inefficient in either cost, duration, or both.
Figure 1.
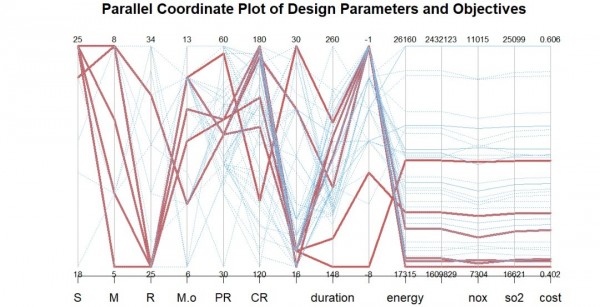
The graph in Figure 2 is generated to illustrate the accumulated impact of input parameters on overall performance in the maintenance optimization process. This parallel coordinate plot visually represents the relationships between design parameters (S, M, R, M.o, PR, CR) and key performance metrics (duration, energy consumption, NOₓ emissions, SO₂ emissions, and cost). Each line in the graph corresponds to a specific maintenance scheduling scenario, with red lines representing Pareto-optimal solutions and blue lines representing all evaluated scenarios.
Figure 2.
Discussion
The parallel coordinate plot highlights the trade-offs between maintenance parameters and key performance objectives. As the frequency and intensity of maintenance activities (S, M, R, M.o, PR, CR) change, their impact on total duration, energy consumption, and cost becomes evident. The variation in maintenance events significantly influences energy consumption and emissions, suggesting that bundled maintenance strategies can help mitigate environmental effects. Additionally, a strong correlation is observed between duration and cost, indicating that lower-cost maintenance strategies often lead to longer intervention durations. Moreover, energy consumption and emissions (NOₓ, SO₂) appear interconnected, meaning that reducing maintenance duration can also lower environmental impact. The Pareto-optimal solutions (red lines) in the plot highlight maintenance schedules that achieve the best trade-offs among competing objectives, effectively balancing cost, emissions, and energy efficiency. These insights help engineers select an optimal maintenance strategy that aligns with both economic and environmental goals, ensuring sustainable long-term system performance.
These insights from the parallel coordinate plot guide the evaluation of different maintenance strategies. The following scenarios illustrate distinct trade-offs, helping engineers choose the optimal balance between cost, emissions, energy efficiency, and time.
Scenario One Results
Scenario one results in a low cost while maintaining moderate energy consumption. The NOx and SO2 emissions in this scenario are within acceptable limits, making it environmentally friendly. However, there is a slight increase in duration, suggesting that while this scenario optimizes cost and emissions, it may require a longer processing time. This trade-off is crucial for decision-making, depending on whether time efficiency is a critical constraint.
Scenario Two Results
Scenario two focuses on minimizing emissions (NOx and SO2), which makes it the most environmentally friendly option. However, this scenario comes at the expense of higher energy consumption and increased cost. This trade-off is often seen in designs where strict environmental regulations are prioritized, requiring additional energy-intensive processes to control emissions.
Scenario Three Results
Scenario three achieves an optimal balance between cost and energy efficiency. Unlike scenario one, where duration was longer, this scenario maintains a reasonable processing time while keeping energy consumption moderate. The emissions (NOx and SO2) are slightly higher than in scenario two but remain within acceptable levels. This makes scenario three an ideal choice for applications where both cost and energy efficiency are critical factors.
Scenario Four Results
Scenario four focuses on minimizing duration, making it the best choice when time efficiency is the primary goal. However, due to the faster processing time, this scenario results in higher energy consumption and moderate costs. Emissions (NOx and SO2) are slightly elevated compared to the other scenarios, but if reducing process time is a priority, this trade-off might be acceptable.
Limitations
Despite the comprehensive analysis presented in this report, several limitations must be acknowledged. The study assumes that maintenance coordination is feasible in a real-world urban setting; however, challenges such as legal restrictions, stakeholder conflicts, and municipal regulations may impact actual implementation. Additionally, the availability of skilled labor and materials at different maintenance intervals could influence the feasibility of the planned maintenance strategies, potentially causing delays or cost overruns. Furthermore, the report primarily focuses on two maintenance strategies—uncoordinated and bundled—but does not explore alternative hybrid approaches that could provide additional flexibility and efficiency. Another key limitation is the focus of the Pareto front analysis, which optimizes maintenance planning based on cost and duration but does not explicitly consider other critical factors such as safety, ease of implementation, and adaptability to new regulations.
Moreover, we extend the frequency of one maintenance method (R) from 40 to 45 years to optimize the maintenance plan, which effectively reduces the total maintenance duration. However, this adjustment introduces potential risks to the building’s structural integrity. Delaying maintenance beyond the original 40-year mark may lead to unforeseen deterioration, increasing the likelihood of structural issues or system failures. This trade-off requires further research to assess the long-term impact on safety, reliability, and overall lifecycle performance before finalizing the optimized maintenance schedule.

