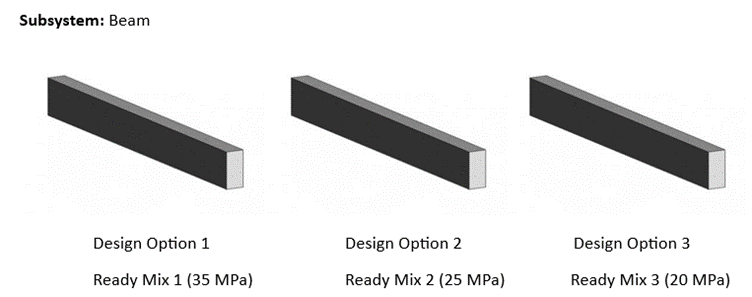
The design options all follow the same approach of being cast in place concrete. However, they vary with respect to the ready mix design and the factors affecting that are the quantities of cement, coarse aggregate, fine aggregate etc. (Marceau 2007). The design options also vary in terms of the compressive strengths as mentioned above.
Goal and Scope
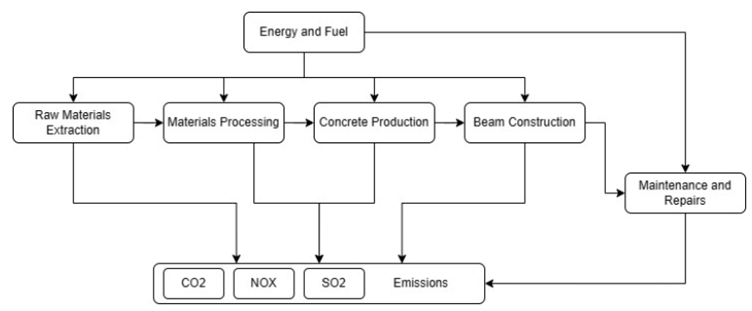
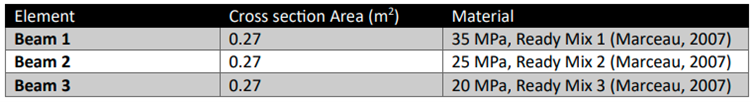
The above picture shows the scope and boundaries of our exercise, and the below tables tabulate the design options and their properties that we have for this exercise. Following are the different design options.
Life Cycle Inventory of different materials, Performance, and Environmental indicators
The various materials utilized, and their composition are shown in the following table. We gathered data for each material on CO2, NOx, SO2 (kg/m3), and energy usage for processing and manufacture (MJ/t).
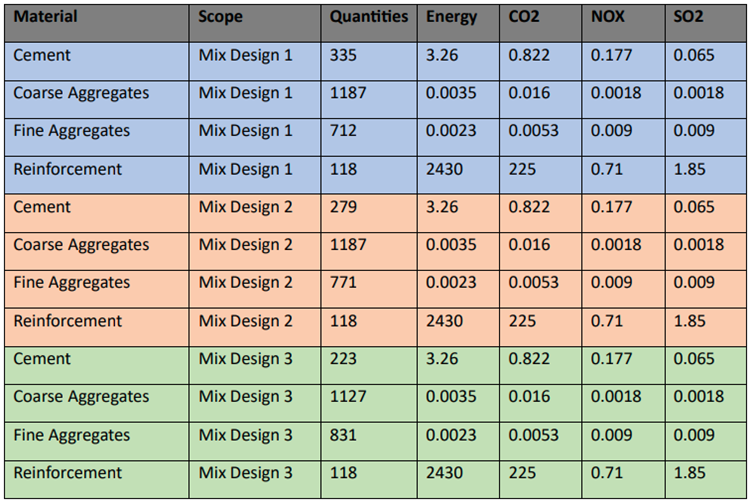
The scope column basically shows that three types of mix designs have been used for the three types of design options respectively. The quantities of each type of mix design vary as can be seen in the table above. Now keeping in mind that the table shows the materials consumed to make 1 cubic meter of concrete. Respectively, the quantity of steel has been assumed to be 1.5% of the concrete volume being 1m3 which comes out to be 118kg. All the other quantities are in kgs as well.
System Lifespan with Interventions
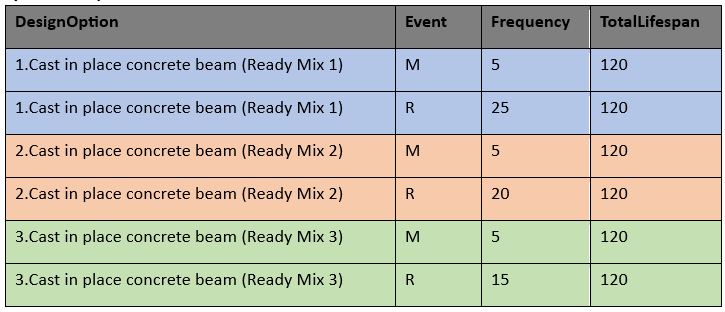
For our system, beam, we have tabulated two different type of interventions which are Maintenance and Repair. The total lifespan has been taken as 120 as it is the lifespan of a frame structure building.
M=Maintenance
R=Repair
The frequency of these interventions has been assumed and extrapolated from experience and professional consultation.
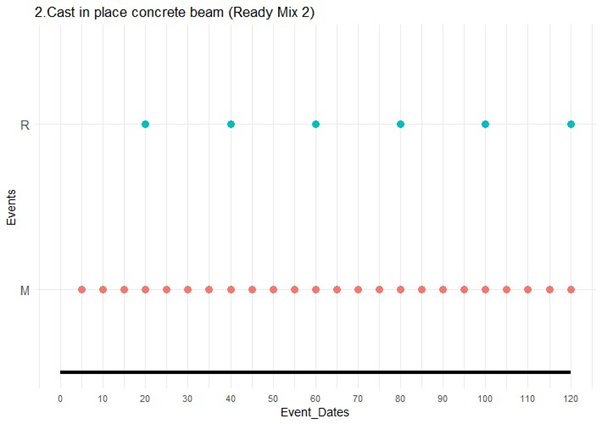
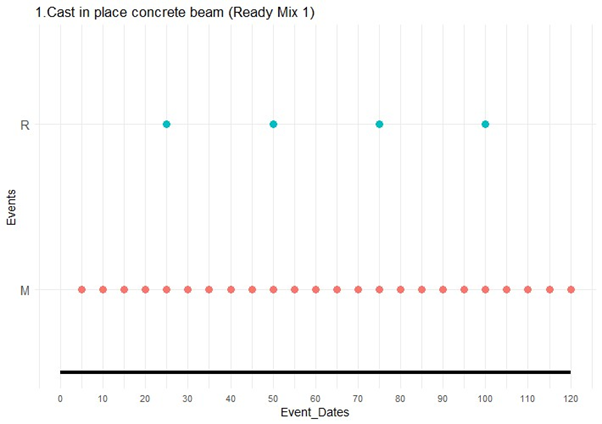
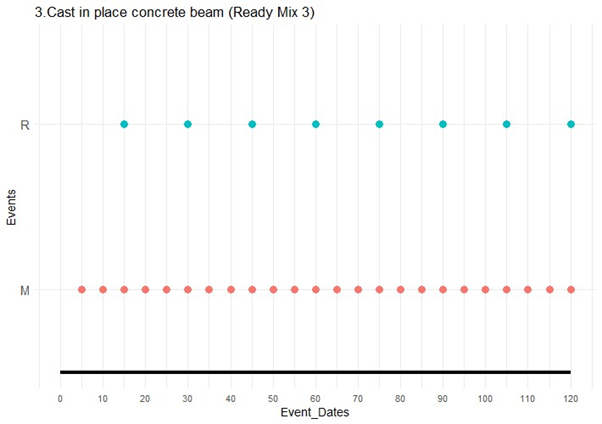
This table was then used to display the interventions on a timeline using Shiny web application which was accessed through R. The resulting plots can be seen below.
Life Cycle Inventory and Analysis
For this part of the exercise, we defined a function based on the dimensions of the beam and the different proposed design options which computed the total energy consumption and also the total emission (CO2, NOX, SO2). Furthermore, we also included intervention frequency into the code as well as the beam length, width, and depth.
After running the code we obtained bar plots comparing the energy consumption and the emissions of different design options. These bar plots can be seen below.
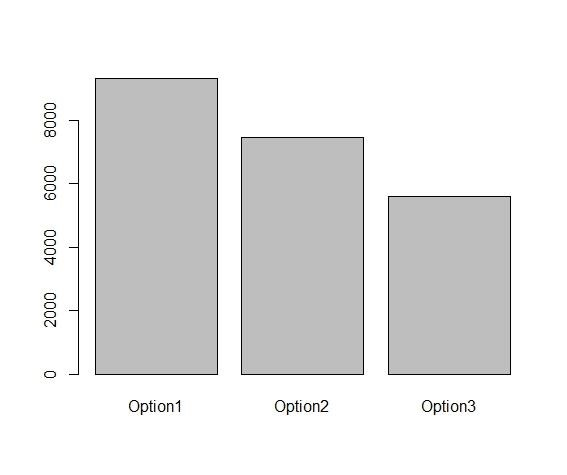
Figure 1: Energy consumption levels for different design options
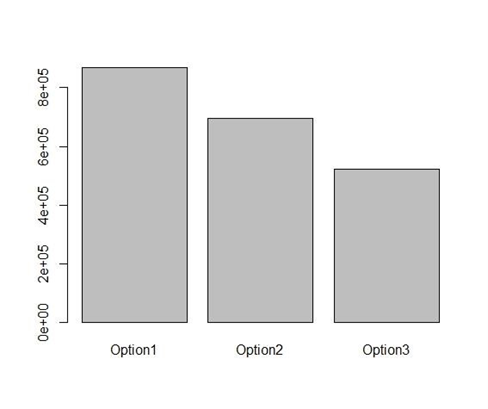
Figure 2: CO2 emissions for different design options
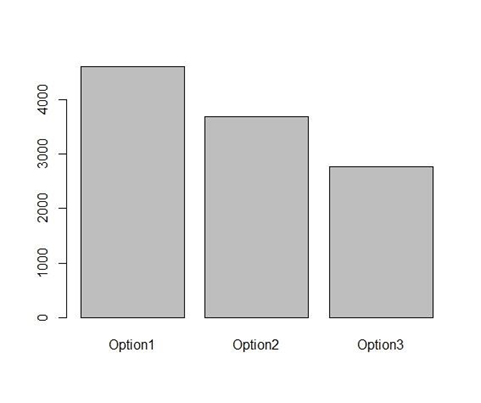
Figure 3: NOx emissions for different design options
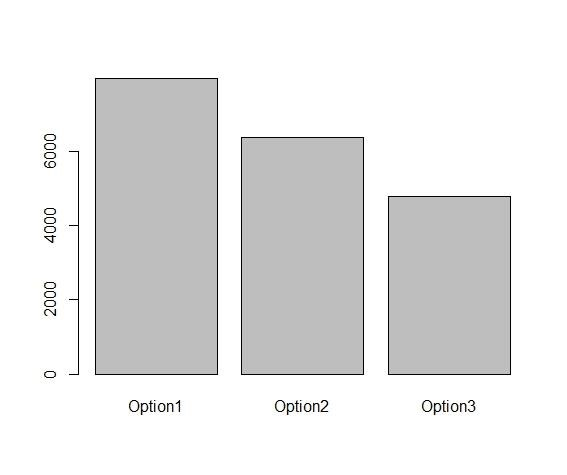
Figure 4: SO2 emissions for different design options
Looking at these bar graphs for all the indicators it can be concluded that the Design Option 3 is the favorite because it has the lowest values for all the indicators.
MCDM – Analytic hierarchy process (AHP)
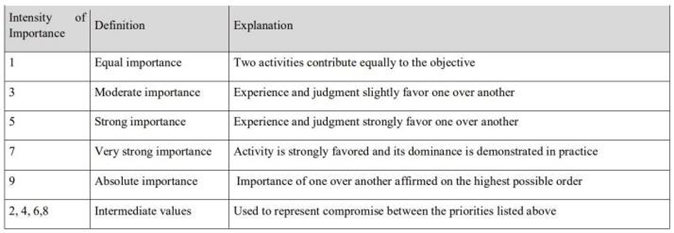
Using these values from the Saaty scale shown above, score matrices were made for all the criteria. After which another score matrix was made but this time to compare the criteria themselves against one another. And then the code was run and the results were obtained in the form of a pie chart graph which can be seen below:
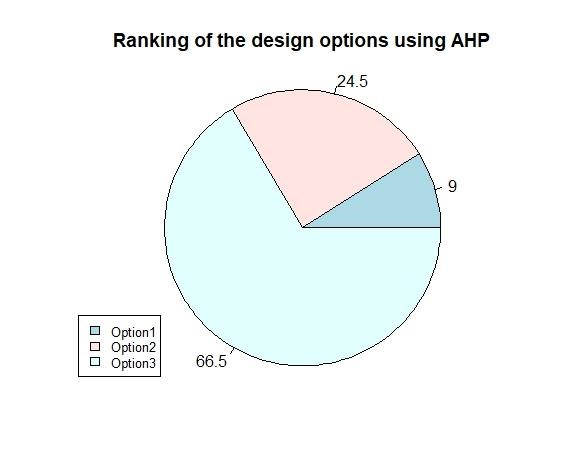
Now this Pie chart graph, also shows that the Design Option 3 is the best out of the three in terms of all the indicators. Hence, when the goal is to consume the least amount of energy with the least amount of emissions in the shape of CO2, NOx and SO2, the best choice is the Design Option 3.
References
- Marceau, M., Nisbet, M.A. and Van Geem, M.G., 2007. Life cycle inventory of portland cement concrete. Portland Cement Association.
(http://www.nrmca.org/taskforce/item_2_talkingpoints/sustainability/sustainability/ sn3011%5B1%5D.pdf)
- Texas A&M University, Reinforced Concrete (http://facultylegacy.arch.tamu.edu/anichols/index_files/courses/arch614/NS21-1cncrtdesign.pdf)